Business Profile of the AYE Finance Limited
AYE Finance is a leading non-banking financial company in India, offering loans to micro, small, and medium enterprises (MSMEs) across the country. With 508,224 active unique customers across 18 states and three union territories, the company has AUM of around Rs. 5, 000 crores million as of Sep 30, 2024. The company is the most geographically diversified lender among peer MSME focused NBFCs, with its top three states accounting for less than 40.00% of its total AUM. Its growth has been driven by diversified growth, right product market fit, unique underwriting capabilities, and technology-driven operational efficiency.
The company has a large target addressable market of over 97.13% of MSMEs in India, which is credit starved and has limited access to formal credit. The company targets micro scale businesses with annual turnovers ranging from Rs. 20 lakh to Rs. 1 crores, predominantly located in semi-urban areas.
AYE Finance Limited IPO Objective
As per the draft red hearing prospects, the IPO issue consists of both fresh issue and offer for sale.
- The OFS consists of up to 2,32,55,813 Equity Shares aggregating up to Rs. 300.00 cr. Nothing from those proceeds of OFS will be allotted to company.
- AYE Finance IPO offer only has fresh issue of Rs. 710.00 cr. The way IPO proceeds will be used has not been mentioned in the DRHP.
IPO Details of AYE Finance Limited:
| IPO Open Date | Mon, Feb 9, 2026 |
| IPO Close Date | Wed, Feb 11, 2026 |
| Basis of Allotment | NA |
| Listing Date | Mon, Feb 16, 2026 |
| Face Value | ₹2 per share |
| Price | ₹122 to ₹129 per share |
| Lot Size | 116 Shares |
| Total Issue Size | 7,82,94,572 shares |
| (aggregating up to ₹1,010 Cr) | |
| Fresh Issue | 5,50,38,759 shares |
| (aggregating up to ₹710 Cr) | |
| Offer For Sale | 2,32,55,813 shares of ₹2 |
| (aggregating up to ₹300 Cr) | |
| Issue Type | Book Built Issue IPO |
| Listing At | BSE & NSE |
| QIB Shares Offered | Not less than 75% of the Net Offer |
| Retail Shares Offered | Not more than 10% of the Net Offer |
| NII (HNI) Shares Offered | Not more than 15% of the Net Offer |
Issue Price & Size: AYE Finance Limited IPO
The issue size of the IPO has been declared and the overall issue size of the IPO is Rs 1010.00Cr, out of which 5,50,38,759 Equity Shares, aggregating up to Rs 710.00 cr, comprise of fresh issuance, and the remaining Rs 300.00 Cr will be offered for sale by shareholders.
Launch Date of AYE Finance Limited IPO
Aye Finance Limited IPO will be open on Feb 9, 2026 and close on the, Feb 11, 2026. All types of investors can bid between these dates through their eligible categories.
AYE Finance Limited Financial Statements
| Particulars | For 6-Mon ended | FY24 | FY23 | FY22 | |
| Sep 30, 2024 | Sep 30, 2023 | ||||
| Revenue from operations | |||||
| Interest income | 6402.39 | 4273.79 | 9486.86 | 5664.85 | 4098.6 |
| Fees and commission income | 50.04 | 215.72 | 478.64 | 254.8 | 135.7 |
| Net gain on de-recognition of financial instruments under amortised cost category | 17.01 | 86.9 | 189.48 | 125.1 | – |
| Net gain on fair value changes | 252.96 | 143..7 | 247.2 | 189.5 | 84.9 |
| Total revenue from operations | 6922.4 | 4720.11 | 10402.18 | 6234.25 | 4319.2 |
| Other income | 248.05 | 110.4 | 315.32 | 199.1 | 115.7 |
| Total income | 7170.45 | 4830.51 | 10717.5 | 6433.35 | 4334.9 |
| Expenses | |||||
| Finance cost | 2292.57 | 1480.99 | 3265.31 | 1979.3 | 1585.5 |
| Net loss on fair value changes | 62.59 | 26.9 | 61.8 | 65.7 | 21 |
| Impairment on financial instruments | 1013.9 | 413.49 | 1314.01 | 733.5 | 1211 |
| Employee benefit expenses | 1739.09 | 1312.1 | 2752.1 | 2122 | 1757.6 |
| Depreciation and amortization expense | 97.63 | 65.61 | 145.44 | 114.47 | 99.7 |
| Other expenses | 523.58 | 392.49 | 900.27 | 704.12 | 434.22 |
| Total expenses | 5729.36 | 3691.58 | 8438.94 | 5719.38 | 5109.02 |
| Profit / (Loss) before tax | 1441.09 | 1138.93 | 2278.56 | 713.96 | 674.12 |
| Profit / (Loss) for the year / period | 1078 | 787.89 | 1716.79 | 438.353 | -513.5 |
| Particulars | For 6-Mon ended | FY24 | FY23 | FY22 | |
| Sep 30, 2024 | Sep 30, 2023 | ||||
| Number of Branches | 499 | 398 | 478 | 398 | 311 |
| Number of States/UTs | 21 | 21 | 21 | 21 | 20 |
| Assets Under Management (AUM) | 49797.64 | 33683.72 | 44632.91 | 27215.51 | 17284.86 |
| AUM Growth YoY | 47.84 | 71.83 | 64 | 57.45 | 10.13 |
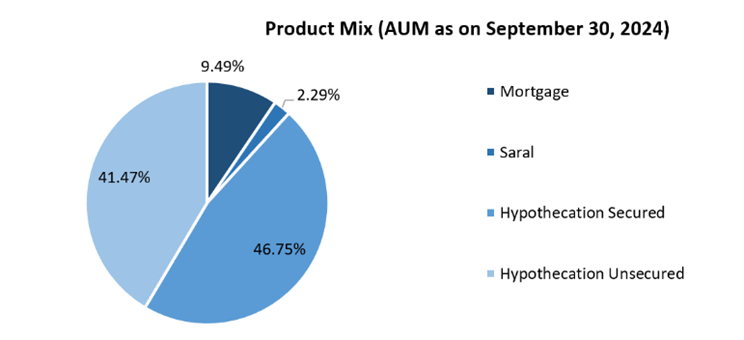
| AUM Mix by Product | |||||
| Hypothecation secured | 46.75 | 58.5 | 51.94 | 63.6 | 55.06 |
| Hypothecation unsecured | 41.47 | 33.89 | 37.91 | 30.26 | 36.61 |
| Saral’ Property Loans | 2.29 | 3.43 | 2.65 | 4.27 | 7.81 |
| Mortgage loans | 9.49 | 4.18 | 7.5 | 1.86 | 0.52 |
| AUM per Branch | 99.79 | 84.63 | 93.37 | 68.38 | 55.58 |
| Retention Rate | 49.03 | 44.28 | 49.59 | 41.18 | 40.59 |
| Disbursements Total | 20141.46 | 16190.05 | 39389.34 | 23570.93 | 13042.48 |
| Disbursements in Repeat loans | 9114.24 | 5966.8 | 14897.96 | 6048.8 | 5026.51 |
| Disbursement Growth YoY | 24.41 | 97.45 | 67.11 | 80.72 | 95.22 |
| Disbursement Mix | |||||
| Hypothecation secured | 43.81 | 53.72 | 50.32 | 66.27 | 63.94 |
| Hypothecation unsecured | 46.48 | 38.27 | 40.15 | 28.384 | 32.15 |
| ‘Saral’ Property Loans | 1.37 | 2.09 | 1.8 | 2.92 | 3.7 |
| Mortgage loans | 8.34 | 5.92 | 7.73 | 1.97 | 0.21 |
| Disbursement per LA | 31.31 | 34.56 | 82.23 | 78.83 | 43.37 |
| Average ticket size on Disbursement (overall) | 0.15 | 0.14 | 0.15 | 0.13 | 0.12 |
| Average ticket size on Disbursement (Repeat loan) | 0.19 | 0.18 | 0.18 | 0.17 | 0.13 |
| Total Interest Income | 6402.39 | 4273.79 | 9486.86 | 5664.85 | 4098.6 |
| Total Income | 7170.45 | 4830.51 | 10717.5 | 6433.35 | 4434.9 |
| Finance Cost | 2292.57 | 1480.99 | 3265.31 | 1979.6 | 1585.5 |
| Net Interest Income (NII) | 4109.82 | 2792.8 | 6221.55 | 3685.25 | 2513.1 |
| Operating Expense | 2360.3 | 1770.2 | 3797.82 | 2940.59 | 2291.52 |
| Profit After Tax | 1078 | 787.89 | 1716.79 | 438.53 | -513.5 |
| Return On Equity (RoE) | 15.22 | 1973 | 17.22 | 5.99 | -7.05 |
| Yield on Net Advances | 29.58 | 29.72 | 28.43 | 26.19 | 24.93 |
| Yield on Gross Advances | 28.63 | 29.08 | 27.65 | 25.54 | 23.85 |
| Net Interest Margin (NIM) | 15.37 | 15.42 | 15.55 | 13.54 | 11.31 |
| Cost of Borrowings / Average cost of borrowing / fund | 1.64 | 11.26 | 11.4 | 11.8 | 12.99 |
| Average cost of borrowing / funds | 8.57 | 8.18 | 8.16 | 7.27 | 7.14 |
| Return on average Total Assets | 4.03 | 4.35 | 4.29 | 1.61 | -2.31 |
| Credit cost to Average Total Assets | 3.79 | 2.28 | 3.28 | 2.69 | 5.45 |
| Operating Expense to Average Total Assets | 8.83 | 9.77 | 9.49 | 10.8 | 10.32 |
| Capital to risk weighted assets ratio | 37.61 | 29.97 | 32.79 | 31.07 | 36.03 |
| Cost to Income Ratio | 48.39 | 52.85 | 50.96 | 66.03 | 80.42 |
| Gross NPA | 3.32 | 2.69 | 3.19 | 2.49 | 3.29 |
| Net NPA | 1.15 | 1.26 | 0.91 | 1.28 | 1.37 |
| PCR (Provision Coverage Ratio) | 66.07 | 53.83 | 72.14 | 49.82 | 59.12 |
| Debt to Equity (D/E) ratio | 2.56 | 3.78 | 2.83 | 3.03 | 2.16 |
| Net Worth | 15966.33 | 8389.95 | 12361.06 | 579.52 | 7054.05 |
| Borrowings/Total Debt | 40831.01 | 31730.71 | 34989.9 | 22961.61 | 15207.4 |
| Average disbursal per Branch | 40.36 | 40.68 | 82.4 | 59.22 | 41.94 |
| Collection efficiency (%) | 92.38 | 94.51 | 93.95 | 93.1 | 85.75 |
| Number of Active customers | 508.224 | 367766 | 454586 | 305524 | 191338 |
AYE Finance Limited Promoters & Shareholding
AYE Finance does not have an identifiable promoter in terms of SEBI ICDR Regulations and the Companies Act, 2013. Below mentioned is list of shareholders holding 1% or more as on date of this DRHP.
| Name of Shareholder | % of pre-Offer Equity capital on fully diluted basis | Selling shareholders |
| Elevation Capital V Limited (formerly known as SAIF Partners India V Limited) | 16.19 | |
| LGT Capital Invest Mauritius PCC with Cell E/VP | 14.13 | |
| Alpha Wave India I LP | 11.21 | Aggregating up to Rs.1,000 million |
| CapitalG LP | 10.26 | Aggregating up to Rs.1,300 million |
| British International Investment plc | 9.51 | |
| A91 Emerging Fund I LLP | 9.23 | Aggregating up to Rs.1,000 million |
| IMP2 Assets Pte. Ltd. | 7.12 | |
| MAJ Invest Financial Inclusion Fund II K/S | 5.97 | |
| CapitalG International LLC | 33.01 | Aggregating up to Rs.68 million |
| Sanjay Sharma | 2.89 | |
| Shankh Corporation LLP | 2.21 | |
| Shvet Corporation LLP | 2.21 | |
| Vikram Jetley | 1.51 | |
| Aye Finance Employees Welfare Trust | 1.46 | |
| Waterfield Alternative Investments Fund I | 1.25 |
Should You Subscribe to AYE Finance Limited IPO or Not
While investing or subscribing to any IPO, consider the investment rationales related to the company. Hence, here you can find out the strength of the company that will be its growth factor and also check the risk factors that can affect the growth and operational efficiency of the company.
Competitive Strengths of AYE Finance Limited:
Leading lender of small-ticket loans
The company is a leading provider of micro enterprise lending in India, offering a full product line of secured and unsecured loans to serve a large unaddressed customer segment. MSMEs in India contribute approx 30% to the national GDP and face a substantial credit imbalance. Only 25.00% of this unmet credit is met through formal financing. The credit gap for micro businesses is estimated to have increased to Rs. 53.00 trillion as of FY24.
The company’s deep understanding of micro scale businesses allows it to address the specific needs of a customer segment that remains largely untapped by competitors, providing a clear competitive advantage.
Diversified Pan India presence
The company is the only diversified pan-India player in the micro enterprise lending segment among the Peer MSME Focused NBFCs. The company’s strategy to spread AUM growth across regions and avoid concentration in particular states. The company’s AUM has increased from Rs. 1, 700 in FY22 to over Rs. 4, 000 crores as of FY24. As of Sep 30, 2024, the company’s footprint across India covers 387 districts, 18 states, and three union territories, with 499 branches.
| Particulars | As of September 30, | FY24 | FY23 | FY22 | |
| 2024 | 2023 | ||||
| Repeat customers | 46958 | 33105 | 80290 | 35253 | 39446 |
The company relies entirely on in-house origination to attract new customers, ensuring minimal compromise in quality and underwriting of lending risks based on factual data. The company’s wide geographic presence allows it to attract new customers from large catchment geography.
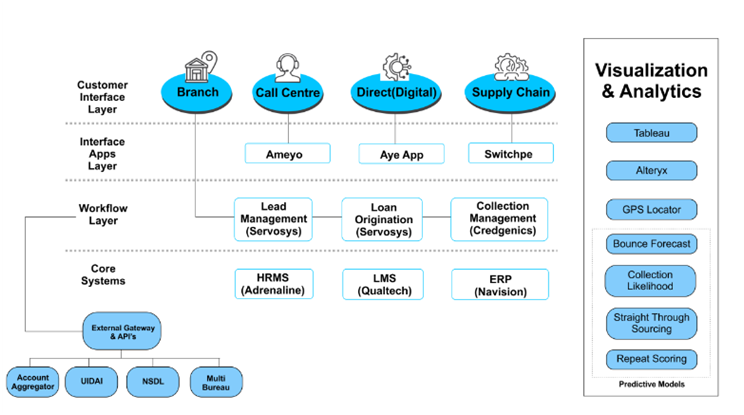
Technological prowess business model
The company uses a ‘phygital’ business model that combines physical and digital channels to optimize operations. This allows for efficient cluster-based underwriting, economic loan ticket sourcing, and timely controls. The company uses a flexible, cloud-based technology stack for scalable operations without significant capital expenditure. Core systems like loan management systems, collection systems, and applications are accessible across all business units.
The company’s in-house data science and AI team collaborates with sourcing, credit, and collections teams to optimize customer journeys. The company offers a mobile application for customers, allowing them to manage loan accounts, track repayments, apply for repeat loans, view transaction histories, and access customer support.
Page 220
Future strategies
- Increasing AUM per branch to meet the credit gap for micro businesses.
- Scale the mortgage loan portfolio to enhance portfolio stability and profitability.
- Leveraging Technology and Data Sciences for Improving Productivity and Scalability
- Improving Operating Leverage and Diversifying Lender Base.
- Prioritize long-term borrowings to ensure stability and mitigate tenor-based liquidity risks.
- Establish alliances with other lenders to maximize benefits for customer.
Risk Factors of AYE Finance Limited:
Risk of defaults
AYE finance serves micro-sized businesses in semi-urban areas with annual turnovers ranging from Rs. 20 lakh to Rs. 1 crores. Lending to MSMEs often presents challenges such as limited financial records and reluctance to provide property as collateral. Customers with limited income and credit histories may pose a higher risk of default. Customers may delay or default on repayment obligations due to business failure, insolvency, or lack of liquidity. Also, starting with no history may force borrowers from taking loans from informal money lenders, which might make it harder for them to repay loan obligations.
| Particulars | As of September 30, | FY24 | FY23 | FY22 | |
| 2024 | 2023 | ||||
| Hypothecation Loans | |||||
| Outstanding amount that are Stage 3 asset | 1421.43 | 768.32 | 1228.7 | 557.2 | 435.4 |
| Percentage of total outstanding amount (%) | 3.49% | 2.62% | 3.34% | 2.28% | 2.75% |
| Loans against Property (Mortgage Loans and ‘Saral’ Property Loans) | |||||
| Outstanding amount that are Stage 3 assets | 126.01 | 87.77 | 87.7 | 95.24 | 112.4 |
| Percentage of total outstanding amount (%) | 2.14% | 3.41% | 1.93% | 5.70% | 7.81% |
NPA and provisioning
The company relies heavily on customer information for credit assessment, following KYC guidelines. The company use third-party service providers for collateral valuation and credit bureaus for records. However, the company cannot predict the accuracy of creditworthiness assessments and may face challenges due to limited documentation of income and lack of credit history. The company’s ability to manage credit quality of loans, measured through assets over 90 days past due, is crucial for its results. However, the company cannot guarantee adequate credit and underwriting systems, and may face increased NPAs due to factors outside its control.
| Particulars | As of September 30, | FY24 | FY23 | FY22 | |
| 2024 | 2023 | ||||
| Gross NPA | 1547.44 | 856.09 | 1316.3 | 653.9 | 572.8 |
| Gross NPA ratio | 3.32% | 2.69% | 3.19% | 2.49% | 3.29% |
| Net NPA | 525.47 | 395.18 | 366.7 | 328.1 | 234.2 |
| Net NPA ratio | 1.15% | 1.26% | 0.91% | 1.28% | 1.37% |
| Provision Coverage Ratio (%) | 66.07% | 53.83% | 72.14% | 49.82% | 59.12% |
| Bad Debts Write-Offs | 773.68 | 234.89 | 546.01 | 525 | 1148.8 |
As per DRHP, the company has filed over 3000 criminal cases against parties, amounting to around Rs. 38 crores. These outstanding legal and regulatory proceedings divert management’s time and resources. Any unfavorable decision could negatively affect the reputation, business fundamental and financial condition.
Unsecured loans
Unsecured loans are offered to micro-enterprise customers, which pose higher credit risk due to lack of realisable collateral. In case of economic slowdown, small scale business are first to hit as they are deprived to easy flow of credit. The terms get stricter are covenants are often hardened. As can be seen from table, the share of unsecured loan represents a bigger pie of overall AUM, increasing the level of vulnerability. Non-payment may result in the inability to collect outstanding advances and failure to recover principal and interest loans could negatively impact the business financials, regulars operations.
| Particulars | As of September 30, | FY24 | FY23 | FY22 | |
| 2024 | 2023 | ||||
| AUM of Unsecured Loans | 20651.66 | 11416.81 | 16921.44 | 8236.06 | 6327.96 |
| AUM | 49797.64 | 33683.72 | 44632.91 | 27215.51 | 17284.84 |
| AUM of Unsecured Loans as a % of AUM | 41.47% | 33.89% | 37.91% | 30.26% | 36.61% |
Business expansion
The company plans to expand its business through branch expansion, new borrower acquisition, and increased productivity. As the business expands into new geographies, it may face challenges such as increased competition, and different cultural norms. The company will need to upgrade its IT, increase overall capital base, operational infrastructure, which required significant capital investment. While their cost to income ratio has improved in past years, along with operating expenditure ratio, it might not be able to sustain the same track if the old branches or even new branches don’t perform up to mark. External factors like demand for loans, domestic economic growth, RBI policies, inflation, competition, and cost-effective debt capital may also affect the business.
| Particulars | As of September 30, | FY24 | FY23 | FY22 | |
| 2024 | 2023 | ||||
| Number of branches | 449 | 398 | 378 | 398 | 311 |
| Number of new branches | 21 | 0 | 83 | 86 | 100 |
| Number of active borrowers | 508224 | 367766 | 454586 | 305524 | 191338 |
| Total income | 7170.45 | 4830.51 | 10717.5 | 6433.35 | 4434.9 |
| AUM | 49797.64 | 33683.72 | 44632.91 | 27215.51 | 17284.86 |
| Cost to Income Ratio (%) | 48.39% | 52.85% | 50.96% | 66.03% | 80.42% |
| Operating Expenditure Ratio | 8.83% | 9.77% | 9.49% | 10.80% | 10.32% |
AYE Finance Limited Grey Market premium
Grey market premium is the premium quoted over the IPO issue price. GMP shows that investors are ready to pay above the upper band of the IPO issue price. GMP is determined in the grey market as per the demand and supply of the shares in the primary market. A grey market is that unofficial ecosystem of unlisted companies’ stocks that start trading even before the launch of the IPO to the date of its listing.
Also Read: What is Grey Market Premium in IPO: How is GMP Calculated & Reliable
However, GMP is not a reliable factor, as it keeps fluctuating as per the demand and supply of shares in the primary market. There are numerous factors that affect the stock market in India and individual stock prices of different companies that are already listed and trading in the secondary market. However, for an IPO-bounded company, you can consider the GMP as the speculative listing price of the share
As per the sources, the GMP of Aye Finance Limited IPO is trading at around Rs 3 in the grey market shows the share of Aye Finance Limited is expected to list at around Rs 132 if you consider the upper price band of Rs 129 announced in the IPO for the bidding.