


In the stock market analyzing the stock price or market index movement is one of the most important factors, to define the right trading strategy. But along with the price you should also analyse the volume in the stock price and index. Volume plays an important role in technical analysis giving a better insight into the liquidity levels and trends in the market.
A volume in the stock market refers to a number of quantities of stock or contracts of underlying assets bought and sold on the exchange within the specified time frame. To see the volume levels you can use the bar graph at the bottom of the price chart that shows the strength or weakness of price movements in the underlying index or the stock price.
While interpreting the volume, you can see when the volume is high, it means there is strong interest in validating the trend. However, when the volume is low, it indicates, a lack of investors’ interest showing the trend is weak and can be reversal. And to analyse the volume data more precisely and efficiently you can use the volume indicators on price charts.
Volume indicators are computational tools that are specially designed and developed to analyse the volume data and its correlation with the stock price or market index movement. And to use or apply the volume indicators on technical charts you can use the TradingView, where you can get the list of best volume indicators in TradingView at one click.
Volume Indicator TradingView
In TradingView you can find various types of technical indicators that you can apply to analyse the stock price or market index movement technically. You can choose from the list of top indicators that are most widely used by traders globally.
However, most of the indicators are based on and applied to the price chart of stock or market index. However, there are various other indicators to analyse the movement and trend in the volume of trade in the stock and broader market index.
Hence, here we will discuss about the best volume indicator in TradingView with guidance to know how to add, remove, read and use the volume indicators in TradingView with the best settings to analyze the same to make the right decisions for the trading.
Also Read: What to Know Before Investing in Stocks: 10 Things to Consider
Top 10 Best Volume Indicators in TradingView:
#1 On-Balance-Volume (OBV)
The on-balance volume (OBV) is one the most useful indicators in TradingView and helps to know the buying and selling activities in the listed stock or market index. OBV indicator is calculated by adding volume when the asset closes higher and subtracting the volume when the asset ends lower. This indicator shows the intensity of the pressure on the buyer and seller.
In TradingView you can plot the On-balance volume below the price chart and use the same to confirm the trend and identify the reversal in the trend. When the OBV lines move above, it means buying pressure is dominating and this often supports the upward trend. Conversely, when the OBV line is moving downwards it indicates the selling pressure is building up and dominating the buyers resulting in a downward trendin the stock price or market Index.
In TradingView, you can interpret the OBV divergences, when OBV moves in the opposite direction of the price chart. If the price is moving downward but the OBV is increasing or moving flat, it means buyers are showing more interest and there may be a reversal in the trend. OBV is also considered a strong indicator of an impending reversal.
#2 Accumulation/Distribution Line (A/D Line)
The Accumulation/Distribution Line (A/D Line) works as a momentum indicator that follows the flow of money into the stock or market index by assessing the price and volume. A/D line uses the stock’s close price in relation to its high-low range for the period with the same period volume. This helps to get more precise details of buying and selling pressure.
Traders use the A/D line to observe the trajectory of the A/D Line to make sure the existing trend persists or find a new emerging trend. The rising A/D line means the buying pressure is building up, while the declining A/D Line indicates the selling pressure is increasing indicating the bearish sentiments.
You can use the A/D line more efficiently in combination with other technical indicators to make sure to strengthen the indicated trading signal. The AD line identifying the positive or negative divergences in price and volume data gives the signal of future price movement in the stock and market index.
Also Read: Top 5 Best Technical Indicators for Intraday or Day Trading
#3 Fixed Range Volume Profile
The Fixed Range Volume Profile (FRVP) is another useful indicator in TradingView to analyze the volume data within a specified time period. This indicator allows the traders to analyse the activity of volume within a certain range instead of the movement of the price of stock or market index. Unlike indicators like the On-Balance Volume or the Accumulation/Distribution Line, the FRVP places more emphasis on identifying the high-volume bars over a specified price range, which is usually between the high and low swings.
The FRVP indicator helps to know where most of the trading activity has happened and also helps to identify the significant support and resistance levels. You can use this indicator to understand where the bulk of trading has occurred within a set range, which often see-through the key areas where the price is most likely to trade. FRVP is mainly helpful for identifying the disparities between supply and demand, making this indicator an important tool for evaluating the potential strength or weakness of future price movements in the stock or the market index.
#4 Money Flow Index (MFI)
The Money Flow Index (MFI)is considered one of the best volume indicators for day trading. It helps to analyse the time, volume and price to show the buying and selling pressure. And using the MFI you can find out the stock or market index in an overbought or oversold zone. It can be also used to identify the divergences and it can generatesignals based on its interpretation of the trading volume data.
The combination of both price and volume helps to get a comprehensive view of market sentiment. To calculate the MFI, multiply each price by the volume for that period which shows the raw money flow. The MFI index ranges between 0 to 100 giving clear signals of overbought or oversold trend in the stock price or market index.
In TradingView you can use the MFI index to identify the market at extreme levels. Suppose if MFI running above 80, indicates the overbought condition that advocates a potential downtrend. While MFI running below 20, gives the oversold condition, that is usually followed by the price uptick. You can use the MFI indicator to predict the trend reversal.
#5 Chaikin Money Flow (CMF)
The Chaikin Money Flow (CMF) indicator in TradingView is known as the volume-weighted average oscillator that accounts for both price and volume to measure the flow of money within a specified period. This indicator gives a price and money flow within the designated time frame that is commonly accounted for 20 or 21 periods.
To calculate the CMF, sum up values and divide them by the total volume for the same period. And in TradiingView you can use the CMF to detect the short-term trends and money flow direction. A positive CMF hovering near 1, typically gives the sentiment of bullish signals, indicating the flow of money in the asset is high. While a negative CMF value near to -1 gives the bearish sentiment and potential of the outflow of money from the assets. CMF is also one of the strong tools to identify potential breakouts or breakdowns in the stock price or market index.
#6 Volume-Weighted Average Price
The Volume-Weighted Average Price (VWAP) is another useful volume indicator in TradingView that takes both price and volume into consideration to show the average price of the stock and market index trading throughout the trading session. In TradingView you can create the custom VWAP indicator with the help of Pine Script by adding the product of price and volume for each bar and that is divided by the cumulative volume.
You can use the VWAP indicator to evaluate, whether the current price of stock is above or below the average price that helps to identify the impending condition of overbought and oversold. For trend confirmation VWAP indicator is also useful to visualize the trend in price action.
Many traders use the VWAP indicator as a useful tool to ensure the market is less volatile. And if a stock price is heading towards above the VWAP range you can create the short-selling position in the stock. You can create relatively small short positions when the price goes above the line and vice versa.
#7 Volume Relative Strength Index
Volume Relative Strength Index (VRSI) is another technical indicator that uses the volume values in the calculation instead of price movement that shows the small changes in the average of trading volume across multiple trading periods. This indicator gives a clearer picture of the market situation and better insights into the trading in the stock or market.
This oscillator-based indicator has values based on percentage with the range from 0 to 100 in which the center line indicates the 50% threshold represents there is no movement in the stock or market index. To interpret, this line, whenever an indicator crosses the centre line, it means that a new trend starts, and is likely to hold the trend for a few days.
You can use the Volume Relative Strength Index indicator to enter into the short position when, the value goes above the centre, while when the value of this volume-based RSI goes below the centre, you can create the long position in the underlying asset.
#8 Price Volume Trend Indicator
In TradingView you can find an unlimited number of volume-based indicators VPT is one of them. This Volume Price Trend Indicator or Price Volume Trend Indicator is not so popular among traders but still can give you useful insights. This is calculated just like On-Balance Volume taking the sum of trading volumes from the different periods and subtracting the change in the price of stock and volume in the percentage point.
Not exactly like the On-Balance Volume indicator but using VPT you can get a slightly different visual representation of what is going on in the market. However, you can interpret this indicator as when the price increases, while the volume is decreasing, which means the trend is giving the indication of reversal that signals the overall trend has turned bearish.
Also Read: Best Option Strategy for Bearish Market: 7 Option Strategies
While on the other hand, when the price moving towards the downward direction but volume is rising, you can consider this signal as the start of bearish movement in the stock and market index. You can use the VPT as a swing indicator that retail traders choose to incorporate for the trend-confirming strategies to create long-term investment positions in the stock or the underlying assets.
#9 Volume Rate of Change (VROC)
The Volume Rate of Change (VROC) indicator in TradingView helps to measure the change in the percentage of volume for a specified period. You can customize this indicator in TradingView by comparing the previous volume with the current volume through a designated number of bars just below the candlestick charts in the TradingView.
You can plot the VROC and traders can identify the significant changes in the volume that may signal the beginning of change in the volume indicating the end of the price trend in the stock. You can find and easily plot the VROC indicator in TradingView with the options to choose or change the parameters and analyse the rate of change in the volume.
#10 Volume & Klinger Oscillators
In TradingView, you can use oscillator indicators like Volume Oscillator and Klinger Oscillator to measure the change in the volume for the trading. You can create the volume oscillator in TradingView to measure the relationship between the two different volume moving averages.
You can define the specific period for the long-term and short-term periods to calculate the difference between both of them. You can plot this volume oscillator to find out the overbought or oversold situation in the stock or the market index based on the convergence or divergence of the two moving averages.
On the other hand, the Klinger Oscillator helps to analyze the strength of a current trend in the market without compromising the view on the chart and the precision of instant changes in the metrics. However, retail traders use to apply this indicator to forecast when the market will reverse its trend.
Also Read: How to Identify Trend in Stock Market: 10 Points to Find Trend
This indicator is a suitable option for intraday traders as it helps to identify the potential movement in price and when there are sudden changes, in a particular direction because of unexpected events or speculation in the market. And the best use of this indicator is, it will help you to see when there is correction starting taking place in the stock.
Also Read: 7 Biggest Mistakes To Avoid While Doing Intraday Trading
In TradingView when you apply the Klinger volume indicator it will be applied at the bottom over the volume bars with of two coloured lines creating an oscillator. These lines are the moving averages of the trading volume and price action as the main source of data. And the divergence between these two lines indicates the current trend in the stock price or market index is strengthening. When these two lines cross each other, in any of the directions, it shows that the trend reversal is taking place right now or the trend is likely to change.
How to Add Volume Indicators in Tradingview?
To add the volume indicators in the trading view you just need to go to the indicators option and search for the volume indicator by typing its name in the search box. When you type the name, all the indicators having the word volume in the name will be visible at the bottom, from where you can choose the most suitable indicator as per your trading strategy.
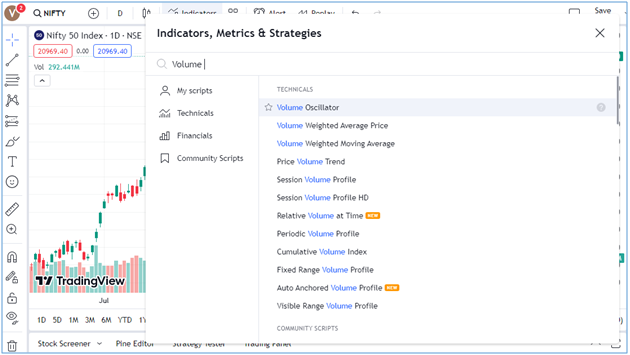
At the top list, you can see the most popular and best volume indicator TradingView. To add the volume indicator in TradingView just click on any of the indicators you want to choose. When you click on the indicator it will be applied on the chart with the default settings, however, you can change the parameters by clicking on the setting icon on the volume indicator.
How to Read Volume Indicator TradingView?
Reading the volume indicator on TradingView totally depends on your level of knowledge and experience in understanding the importance of volume indicators in TradingView. To read the volume indicators you just need to understand the relationship between the volume of trades in the stock and the change in the price of the underlying assets.
Simply, when price falls, and volume increases, it shows that the current trend is gathering strength to the downside movement in the stock. While, when the price touches new highs or lows, and volume decreases, this means the potential change in the trend reversal is likely to take place. Basically, a high volume point means the interest of investors and traders in the stock or underlying market index is high at this current price and vice-versa.
To read the volume indicators you just simply apply the selected indicator and analyse the situation to under the trend in the stock price movement or market index. A sudden increase in the trading volume means there is a chance of an increase in change in price. Any kind of event, news, economic indicator results, or corporate actions by the companies are common moments when there is a sudden change in the volume taking place in the market.
Usually, a strong trend is visible in the market when trading volume increases, hence it is measured as a degree of strength. You should notice the high buying volume at a support level and high selling volume at a resistance level. However, there are several ways, you can read and use the volume-based indicators in your trading strategy.
How to Use Volume Indicators in TradingView?
The Volume indicator is used to measure how much quantity of stocks or underlying market index has been traded in a specific period of time. And volume can be used to measure the strength or weakness of a price movement in the stock or market index.
In the cash market, volume is measured by the number of traded shares on the stock exchange during a specific period, while in the F&O segment or derivatives market, volume is measured in terms of the number of contracts traded on the stock exchange.
Understanding the volume patterns, over a period of time, you can better understand the strengths of advances and declines in stocks or in the market index. You can use the volume indicators to alert trader’s sentiments, and their trading activities towards the specific stock or market index. Hence, it is very important to consider during the market trend.
When the volume increases and the price falls, it means the current trend is getting the strength towards the downside. Conversely, when the price touches new highs or new lows, but the volume decreases, that means there is potential for trend reversal. You can use any of the volume indicators mentioned above in technical analysis to create the right trade positions.
Tips to Use the Volume Indicators in TradingView:
Analyse the Market Conditions: You can use the volume profile to evaluate the balance or imbalance in the market. A properly balanced market shows the symmetrical volume distribution, while an imbalanced market gives the signal of strong directional bias.
Keep Monitoring the Key Levels: While analyzing the volume indicators, pay attention to the VAH, HVNs, POC, VAL, and LVNs. These levels work as a support and resistance and also influence the movement of price in the stock or market index.
Validating the Breakout or Breakdown: You can use the low volume levels in the trade to identify the breakout or breakdown levels, whether the price might move swiftly through these areas just because of the lack of proper liquidity in the market.
Combining with Other Indicators: Always use the volume indicators in combination with other top best indicators in TradingView like Moving Averages, RSI, MACD, Bollinger Bands, FBI Retracement and Oscillators to strengthen your analysis and validate your trading strategy for better profitability.
Also Read: What is Profit Booking in Stock Market: Rules & Best Strategy
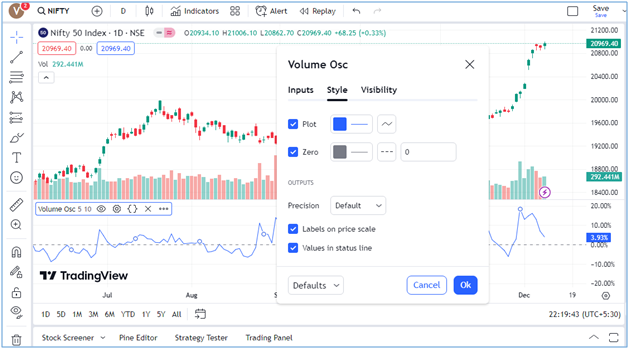
Volume Indicator TradingView Settings
The settings for the volume indicators in the trading view are set as default with best-recommended settings by the TradingView experts. However, you can change the parameters or settings as per your preferred trading strategy in the TradingView.

To apply the volume indicator, just click on the volume menu and search the volume profile you are looking to apply. Just select the desired indicator and it will be plotted on the TradingView chart with options to change or modify the settings directly by clicking the volume indicator panel shown on the bottom at the left-hand side of the chart.

When you open the volume indicator TradingView settings you can change the inputs, style and visibility with the option at the bottom to reset the settings or save as default. In every volume indicator, the best and most recommended settings are automatically applied to give you the best insights into the market index or stock price movement.
However, if you have the technical knowledge and experience in technical analysis or a better understanding of the indicators, you can adjust the settings as per your preferences. You can also get help from market experts to make better use of such indicators in TradingView for better fundamental analysis and technical analysis.
Also Read: Technical Analysis vs Fundamental Analysis: Which is Better
Summing-up
All the above-mentioned are the best volume profile indicators TradingView you can use to analyse the liquidity and price movement in the market. However, in the TradingView chart, you can find the various other indicators recommended by the community experts. However, the top volume indicators are enough to analyse the stock price and market movement.
And to make better use of such tools or indicators including volume indicators in TradingView you must set up the TradingView chart and understand the chart structure in TradingView. However, you can get help from market experts or technical analysts, who use the premium version of TradingView with authorization to get access to apply the more useful volume indicators in combination with other technical indicators and interpret the market situation with better forecasting capability and risk associated while investing or trading in the stock market.
Also Read: Types of Risks Associated with Investing in the Stock Market
Here, you can choose the Moneysukh, to use the TradingView chart freely and enjoy one of the best experiences in trading and investing in the market. You just need to open the trading account and demat account here and you will get access to online trading with the best trading platform in India like Trade Radar, Trade Tron, FoxTrader, AlgoBulls, Keev, Quantman and TradingView at the lowest pricing.
Also Read: Trading or Investing Which is Better and More Profitable
Moneysukh is one the best discount brokers in India, where you get the facility to trade or invest in equities, commodities and currencies with the best application for trading. Here, apart from the traditional way of trading and investing by calling the broker, you can choose the Algo-trading software to enjoy the power of high-frequency trading at the lowest charges with complete privacy of data of clients and security of their funds.
Also Read: How to Start Algo Trading in Moneysukh: A Best Algo Trading Platform


No comment yet, add your voice below!