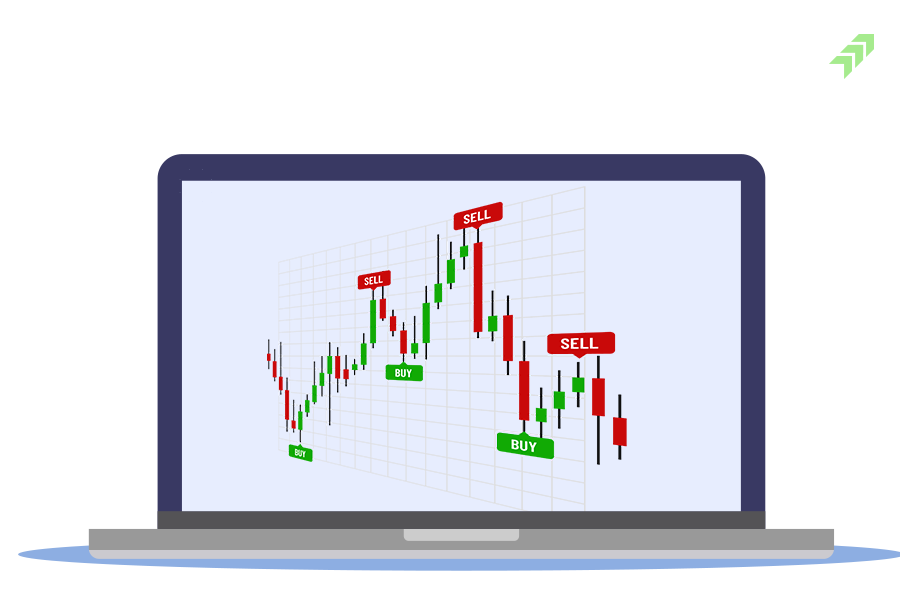
Trading with technical analysis tools gives an indication to put your money at the right time and make some profits. And technical analysis tools work on the price movement creating a type of pattern that helps to predict the next move of the stock or its trend.
There are many technical analysis tools that can be and are used by traders for buying and selling stocks. Bollinger Bands is one the most powerful technical analysis tool that summarizes a stock's price movement by disclosing the relative highs and lows.
What is Bollinger Band Indicator?
Developed by John Bollinger in the 1980s, Bollinger Bands (BB) is a technical analysis tool that follows the price movement of stock and uses the standard deviation to tell the volatility of the stock. There are three bands showing the support and resistance with the range of volatility of the stock.
When the Bollinger Bands expands moving away from each other it means the volatility in the market or stock trading is very high during that period.
While on the other hand, when the Bollinger Bands contract or move closer to each other indicates the volatility is low. And the volatility is measured through the standard deviation that moves when volatility rises or falls. The dynamic nature of Bollinger bands can be applied to various types of trading securities including equities, commodities, and currencies.
How to Read Bollinger Band?
Reading or understanding the Bollinger Bands is very easy. There are three lines upper, middle, and lower, in which the middle band is a moving average that is a determined trader as a parameter. While on the other hand, the upper and lower bands are on opposite sides of the moving average band.
To read and understand the Bollinger Bands read the chart when the price moves closer to the upper end it indicates that the market or stock is overbought. Conversely, when the price moves to the lower end or moves closer to the bottom band it means the market is oversold.
This is how simply you can read the Bollinger bands that indicate the strength of the trend and how much there is potential to go high and low in the near future.
How to Use Bollinger Bands?
To use the Bollinger bands you need to keep an eye on the band that is created with three lines. To use the Bollinger Bands you have to understand the three lines that are plotted on the candlestick chart patterns. The movement of the upper, middle and lower bands is used to determine the support, resistance and volatility of the stock in the near term.
When the price of the stock touches the upper band, again and again, it indicates the overbought signal while when the price touches the lower band it indicates an oversold signal. The Bollinger Bands expand and contract when the price is volatile or moves into a tight pattern respectively showing the right signal.
How are Bollinger Bands Calculated?
As we have already told you Bollinger Bands consists of three lines. The middle line is calculated using the 20-day simple moving average, while the upper band is calculated by accounting for the middle band and adding twice the daily standard deviation to that amount.
While on the other hand, the lower band is calculated by taking the middle band subtracted two times the daily standard deviation. And to calculate the 20 days moving average you have to add the closing prices of 20 consecutive days and divide that value by 20.
What is Bollinger Band Strategy?
Just like other technical analysis indicators, various strategies can be used with Bollinger Bands. However, few strategies are effective or can be operative with Bollinger Bands.
Simply the overbought and oversold strategy is applied but it can be used with the help of certain technical indicators pricing action, RSI, Moving Average and MACD. And these are the most effective Bollinger bands trading strategies that work.
Price Action Strategy: It is a very useful and simple Bollinger Bands strategy but needs additional tools to be effective. And if you are not comfortable using any other additional strategy you can use the price action strategy that would be perfect for you.
This Bollinger Bands strategy comes with two main signals that need to be kept in mind. The price need to reach one of the envelope's borders and price action is the second trigger. And when comprehensively understanding price action this strategy looks very simple for you.
RSI Strategy: This Bollinger bands strategy helps in identifying the value areas on your chart, but using this you can’t find whether the move is strong or weak for trading. When makes touches the new high and higher high, but RSI shows a lower high, which is called a bearish divergence.
While on the other hand, when the market touches the new low and makes a lower low, but RSI indicator is showing a higher low that's called a bullish divergence.
The Options Trading Strategy: Bollinger bands help to identify the stage of increased volatility as well as potential price changes in the asset. Bollinger bands also help to identify the level of volatility whether it is all-time low compared to recent history.
The low volatility in the market means there is consolidation in the market not good for options traders. As they make their trading position as per the new price trend that arises due to a breakout of the price and presence of the market volatility is existing.
Moving Average Strategy: Simple moving average of 200 days is used in the Bollinger bands strategy. The position of price is considered under this relation to the MA200. If the price is upper than the moving average, the stock is in an uptrend which implies it is giving a signal of buy.
This moving average strategy can be used for long-term and when the price goes below the MA200, you can exit from the market anytime to stop your losses.
MACD Trading Strategy: The Moving Average Convergence Divergence Indicator is one of the best supplements that can be used in the Bollinger bands strategy. Using this strategy, the moving average of the MACD crossing each other under the histogram is the easiest way to use both indicators together. This is the first trigger you can use for the next action.
Now you have to analyze the price chart and the position of an asset in relation to the Bollinger bands indicator. The price needs to touch the lower band for the long trades, when this occurs you will be able to buy the stock at this price and wait for profit.
How to Use Bollinger Bands for Day Trading?
The best use of Bollinger Bands is in day trading but with the right combination of other technical analysis tools and strategy. All the tools have their interpretational approach and application. But they can give you an indication of where to buy or sell. And the right combination of Bollinger bands technical analysis tools can give the best results. For more details please logon to Moneysukh
Bollinger Band Trading Strategies:
Reversals: Bollinger bands reversal strategy consists of when a stock approaches the upper band you have to wait and watch how it is going to perform on its next move. When a stock goes parabolic or opens with a gap-up and closes almost its low while trading near the outside of the bands, it is a very good indicator that the stock is likely to correct in the near term.
Double Bottoms: It is one of the most common Bollinger Bands strategies that is formed and characterized when the volume is very high and there is a sharp price pullback that ends the outside the lower Bollinger bands. These kinds of price movements usually result in what is known as an "automatic rally". This rally works like the first level of resistance in the base-building process before the stock moves higher.
When the rally starts, the price touches the latest lows so that it can test the strength of the buying pressure that originated at that bottom. And as per the Bollinger Bands technicians, this retest bar needs to be visible inside the lower band.
This indicates that the downward pressure of stock has decreased and it is shifting from sellers to buyers. The volume should be also dropped sharply while considering this Bollinger Bands strategy for trading.
Riding the Bands: If you are a newcomer you need to be very careful while trading in the stock market. Sell on high and buy on lowest – is the not philosophy applicable in the case of Bollinger bands. As per this Bollinger bands strategy reaching highs or falling at the bottom doesn't gives the buy or sell signal.
While following this Bollinger bands strategy always keep in mind how the volume blasted at the time of break out of the price that further goes outside of the bands. This strategy can be extremely profitable if you follow care fully along with other technical analysis tools.
Bollinger Band Squeeze Screener: Do you know what is Bollinger band squeeze? It simply helps to predict when the squeeze in price starts. Watching the daily chat you can see that when the indicator touches its lowest level in six months then volatility will rise.
Moreover, there is another indicator that can be used like volume expansion or the distribution of accumulation indicator rising further. These supplementary indicators validate there is the possibility of Bollinger band squeeze. To apply this strategy you need the advantage of Bollinger bands to squeeze, as even experienced traders can be also misled.
Middle Bands: This 20-day simple moving average formed middle bands can be configured in different charting applications. When stock price moves according to Bollinger bands middle line can represent areas of support on pullbacks in the market.
As soon as the price moves to the middle line, you can increase your position in this stock. While considering the trend is downward, the stock is likely to fall further and continuing trading outside of the bands indicates a stock is losing its strength.
Summing-up
Basically, Bollinger Bands is a very useful indicator for traders to know about the volatility of the market. If you are using the Bollinger Bands indicator, you easily identify the periods when the market is more likely to break out in the near term.
The best part of using Bollinger bands is it allows options traders to identify potentially profitable trading opportunities. Bollinger Bands squeezes, and expansions indicate low and high price volatility, respectively making the best opportunity for traders.
As per the perceptions when Bollinger Bands quizzes it indicates low volatility and expands indicating high price volatility. Using the Bollinger Bands traders got to know the volatility of the market that plays an effective indicator for the options market.


4 Comments
[…] indicators such as candlestick chart patterns, support and resistance, RSI, Moving averages, Bollinger band, Fibonacci Retracements and Swing Trading are used while performing this technique of stock market […]
[…] Also Read:Bollinger Bands: Indicator, Strategy, Settings& Analysis […]
[…] tools and techniques like examining the formation of candlestick charts, RSI, Moving Averages,Bollinger Band, and Fibonacci Retracementare used to analyze the stocks […]
[…] Also Read: Bollinger Bands: Indicator, Strategy, Settings& Analysis […]