In the stock market trading and investing are done using technical analysis and fundamental analysis. For intraday trading and short-term trading, you can use the technical analysis that can give an idea of where to buy or sell the stock or book profit.
Also Read: What is Profit Booking in Stock Market: Rules & Best Strategy
Traders across the world trading in the financial markets, either its equity, commodity, or currency of cryptocurrency all use technical analysis to make a profitable strategy and earn money from such activities. The question here is whether technical analysis is useful, reliable, effective, profitable and enough for trading or just useless or totally gambling. Today in this article we will find out the answers to these questions about technical analysis in trading.
What is Technical Analysis in the Stock Market?
Before we try to understand the use and effectiveness of technical analysis, let us know what technical analysis in the stock market or trading is.
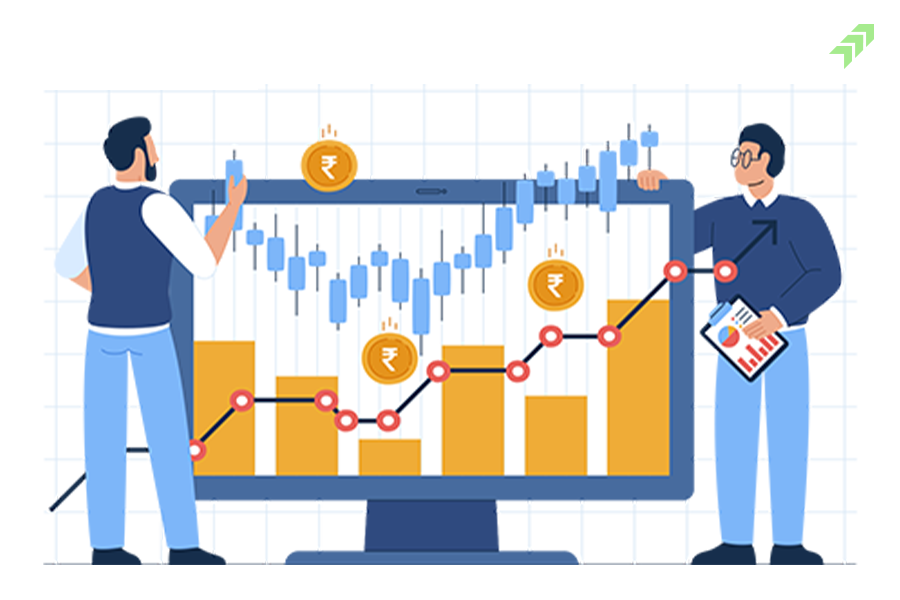
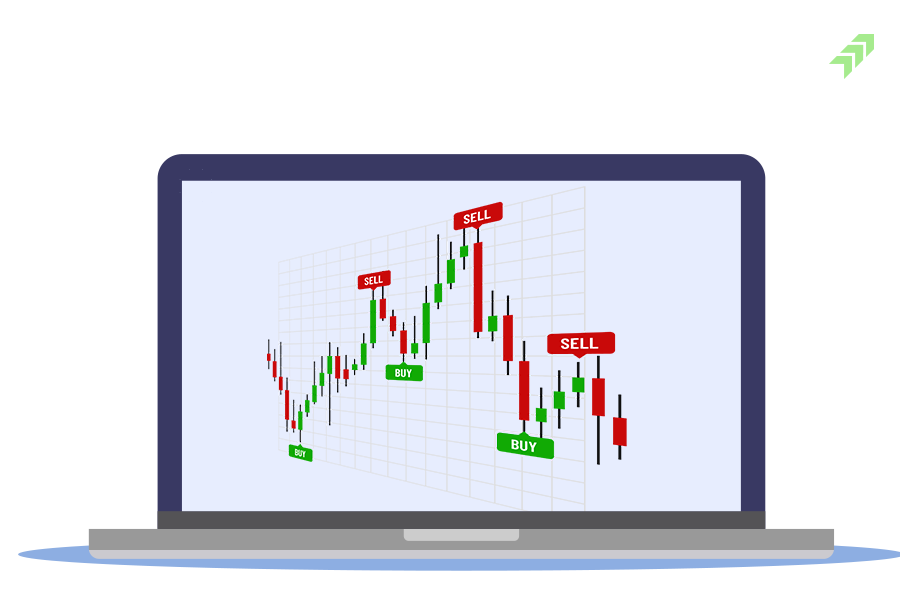
Technical Analysis is the process of using or applying technical indicators to find out the direction of the stock in the next move and plan your trading strategy accordingly. Various tools, techniques and technical indicators are used to analyze the stock price.
The technical analysis is performed on candlestick chart patterns with popular technical indicators like Volume bar, Moving Averages, RSI, Bollinger band, Fibonacci Retracements, Swing Trading, Support and Resistance on stock price or index levels. Using these indicators you can get an accurate idea of stock price movement and take the right trading position.
How Accurate is Technical Analysis?
To measure the accuracy levels of technical analysis there are no such instruments developed in the stock market. The accuracy is highly dependent on the type of indicator you are using, its applicability and how much it gives the right signal. The interpretation levels of the technical analyst and forecasting capability also affect its accuracy.
You can back-test the technical indicators you are using in technical analysis, how much they are effective and which indicator is more effective in various market conditions. It is not necessary technical analysis is not 100% accurate every time or your analysis or interpretation would be accurate every time you predict the stock price movement.
There are lots of uncertainties in the market and various factors work behind the movement of a stock. Economic factors, industry news and company-specific news all affect the stock price movement. In the technical analysis based on chart patterns and past price movement with current trends in stock like volume and technical indicators, the crossover can give the right signal to predict the next move of the stock, but you will be not accurate every time.
How Effective is Technical Analysis?
The technical analysis is no doubt effective if applied with the right tools in combination with the right technical indicators on the right time phrase chart patterns. Just like accuracy, there is no such instrument available to measure the effectiveness of technical analysis.
But when you earn the profit from your trading strategy developed on the basis of technical analysis, it means it is effective and the ratio of effectiveness can be measured when you back-test, your strategy again and again to know how many times it worked.
Many times market conditions are not favourable and do not move as per your expectations, hence technical indicators might not work and the trading strategy could fail resulting in a loss in trade. Hence, not every time technical analysis needs to be effective, sometimes it is not effective and that could be because of inappropriate analysis methods like using the wrong technical indicator misreading the chart patterns or stock moving abruptly.
How Reliable is Technical Analysis?
The reliability of technical analysis depends on the applicability of the user and trust in technical indicators used to perform the technical analysis. If you have extensive knowledge and experience in applying the tools and techniques that work for you, you can rely on this method of analysis, and if you don't know about this then it is not reliable for you.
However, in the stock market either you trade with a short-term earning perspective or invest with a long-term point of view. While making the investing and trading decisions you have to use the fundamental analysis and technical analysis or any one of them to pick the best stock that can give you the maximum returns in a minimum span of time.
In fact, technical analysis is more reliable for short-term trading, while selecting stocks for long-term investment, fundamental analysis is used. In the short term, if the broader market is volatile, other stocks also move with the same trend. Hence, for short-term trading, you can rely on the technical analysis, but for long-term analyses the fundamentals.
Nevertheless, the reliability of technical analysis is highly dependent on the quality of data, choosing the right technical indicators, tools or techniques and most importantly, the skill of the technical analyst to utilize and interpret the chart patterns and trends. However, Technical Analysis would be not enough for trading or even for investing.

Also Read: What to Know Before Investing in Stocks: 10 Things to Consider
To get the best results if you use the combination of both fundamental and technical analysis, you will get more reliable indications from your analysis and can formulate the best intraday trading strategies or pick the stocks for the medium to long term.
Also Read: How to Select Stocks for Intraday: 10 Tips to Pic Best Stocks
Is Technical Analysis Enough for Trading?
As we have told you for short-term trading, technical analysis is more reliable, and for long-term investment fundamental analysis would be more effective. But is the technical analysis enough for trading, no, not at all, in some cases especially for intraday trading you can purely rely on this method of analysis, but not every time it works.
Also Read: 7 Biggest Mistakes To Avoid While Doing Intraday Trading
For trading in the stock market, either short-term or for long-term analyzing the stocks fundamentally is also very important to get the best results. Both fundamental analysis and technical analysis have their advantages and disadvantages, and a combination of both can be used for trading as well as for investing to select the most suitable stocks.
However, for intraday trading technical analysis could be enough if technical indicators give you the right signal of buying or selling the stock. Sometimes for short-term trading, it could be enough, but for long-term investment always analyse the fundamentals of the company. For long-term investment also, you can use technical analysis to find out the best levels to buy the stocks at the lowest point and sell the highest levels to earn the maximum profits.
Is Technical Analysis Useful or Useless?
Technical analysis is useful in terms of finding the stocks for intraday or short-term trading. Technical analysis takes less time compared to fundamental analysis and can be very useful to find out the trend in stock and buying and selling points on the chart.
Using the technical analysis you can find out the entry point or exit point or where you can book profit or buy the stock. The chart patterns can tell you the trend in the stock, whether it is in bullish trend or bearish trend, where its support and resistance. Apart from that Technical Analysis is very useful as there are certain indicators that can tell you the stock is in the overbought zone or overselling zone, or where there is trend reversal in the stock.
Conversely, technical analysis can be useless if not properly applied or if there is unexpected movement in the market or in any individual stock. However, if you are not able to interpret the chart patterns, or don't have an understanding of applying the technical indicators at the right time with the right time phrase, you will be misled and can get the wrong signal in stocks.
For long-term investors technical analysis can be useless, as they don't consider the small fluctuations in the price or do not wait for the stock to come down to its lowest levels. Though many long-term investors also use technical analysis to know the buying point, sometimes such investors don't wait, they just pick the stock where it is right now and add it to their portfolio and forget for many years to get a good amount of returns from such investment.
Is Technical Analysis Gambling?
Trading in the stock market intraday can be a type of gambling. Though you can use or apply the various useful technical indicators, still there are uncertainties in the price movement. Your money can be gone in a day or within a few hours, especially if you bet in day trading or playing in options both are highly risky or you can say gambling.
Also Read: Types of Risks Associated with Investing in the Stock Market
Technical analysis is the process of using technical indicators to find the stock trend or where to buy or sell the stock, If your analysis doesn't work or fails resulting in a loss in trade, means it is gambling. No, it is not betting, as you have tried to analyse the stock but your strategy failed. Gambling means when you pick any stock randomly from the market time to earn profit, it can be called a blind game or purely just like gambling.
Hence, technical analysis is not gambling, if you use the indicators, tools and techniques precisely it can give the right signal or trend in stock. Using the combination of various indicators, you can find out the best point to buy or sell the stock and book the profits or exit to minimize your losses. Based on the historical charts patterns and behaviors of stock in certain market conditions, technical indicators can give you the right indication to enter into trade.
Is Technical Analysis Profitable?
Why not, technical analysis is profitable if performed and executed perfectly and creates the right trading strategy. Though, no there is such tool to measure the profitability levels when you perform the multiple trading sessions and calculate your profit and loss from the trade done based on the technical analysis, the overall return will be profitable.
For intraday or short-term trading you don’t have any other options except using the technical analysis to enter into trade. And in a single or couple of trades, it is not necessary that your trades will be profitable, you can incur loss too.
When you learn from your failures or wrong interpretations in technical analysis, with the time being you will become more proficient in applying the technical indicators more resourcefully and analyzing the stock for better profitability. However, investors looking to pick the stocks for long-term investment perspective can also use the technical analysis.
Is Technical Analysis Useful for Long-Term Investment?
Yes, along with short-term trading, technical analysis is very useful for long-term investment too. Yes, you can use the indicators, tools and techniques to find out the trend in the stock, where to buy the stock to get the maximum gain and where to sell to book the profits at the best levels. However, for long-term investment use the fundamental analysis to pick the stock of a company that is fundamentally sound and has the potential to grow in the near future.
Technical analysis helps to check the current price of stock, whether is it under priced or overpriced, and where to buy or sell, by finding the support and resistance. If a stock is fundamentally very strong the stock would be also trading in a bullish trend. Buying at high levels can be risky, hence, you can use technical indicators and wait to come down.
If a company is fundamentally very weak and the stock is also trading into a downward or bearish trend, using the technical indicators, you can create short-selling positions in the stock when it goes up and earn money from selling the stocks. Technical indicators can give you the right signal where to buy, sell or cover your short-selling position.
Also Read: What is Short Covering in Stock Market & How to Identify Rally
Is Technical Analysis Needed for Options Trading?
Just like intraday trading in the cash market, you can also apply the technical indicators in the options trading. In options, the premium price of CALL and PUT are traded on the stock exchange, and traders use this premium price on charts to analyse the chart patterns and apply the technical indicators to find out the trend in stock or buying or selling levels.
But let me tell you one thing, in option trading, the CALL and PUT options are based on the underlying security trading in the cash market. Hence, the movement in the cash market segment of stock also affects the price of option premiums in the F&O.
However, there are various other factors in options trading that affect the price of the underlying security. In options trading contracts expire monthly and due to the time value of money, when the expiry date comes near the premium of options also changes. Open interestin options or you can say demand and supply in the contract also affects the price.
Also Read: Nifty Open Interest: How Traders Use Change in Nifty OI for Data Analysis
Thus, technical analysis is necessary for options trading, but you need to apply it in a cash market price chart to know the stock trend. Based on the indication given through the technical indicators, you can create your options trading strategies and earn profits. However, some expert technical analysts can also use the options premium price charts to analyse the movement of CALL and PUT while considering other factors in options trading to generate profits.
How to Use Technical Analysis in Trading?
To use the technical analysis in trading you should have to apply various tools and techniques on the candlesticks chart patterns. Using these tools and techniques you can identify the trend in stock, and draw the support and resistance levels to find out the entry and exit point in any stock. For day trading or short-term technical analysis is the best tool.
Also Read: How to Read, Analyse& Use Candlestick Chart Patterns for Trading
To perform the technical analysis you can use popular technical indicators like volume bar, momentum oscillators like RSI, Bollinger Bands, MACD, Fibonacci Retracement, Support and Resistance etc. Using these tools you can find out where the stock is heading, the buying and selling zone of stock and the trend reversal point to form a trading strategy.
Using or applying these technical indicators on a candlestick chart is possible when you have the technical knowledge, skills and experience to draw the tool or interpret the indications or signals given by these tools. To apply this technical indicator you also need real-time market data and reliable software compatible with your computer system.
Also Read: Top 5 Best Technical Indicators for Intraday or Day Trading
Here you need an expert who has extensive knowledge and experience in technical analysis and can help you in trading based on technical analysis and popular indicators that are used to pick the stocks. Moneysukh provides one-stop investment and trading solutions for people looking to invest or trade in the equities, commodities and currency markets.
Moneysukh operates with world-class trading and investment facilities offering clients one of the best online trading platforms for trading and investing. A team of fundamental and technical analysts working here using advanced software systems and tools or techniques to perform the technical analysis and other research activities recommending the clients with daily tips to buy and sell stocks, commodities and currencies.
Apart from a human-intelligence-based traditional trading system, Moneysukh also provides the best algo-trading platform for clients to enjoy high-frequency trading from anywhere choosing the best Algo-trading software and strategy and earning profits. So, what are you waiting for just open the trading account and demat account with Moneysukh now?
Also Read: What are the Most Popular & Profitable Algo Trading Strategies
Here along with daily, weekly and monthly tips for intraday, short-trading in equities, commodities, forex market and F&O market, you will also get recommendations for long-term investment in stocks. You will also get newsletters regarding market news and other updates with informative articles on stock market to help you understand the various things about the trading and investing in the stock market.
Also Read: Trading or Investing Which is Better and More Profitable


No comment yet, add your voice below!