


Moving averages (MA) are technical analysis tools for trend detection and for smoothing out price data. They are too used to spot price reversals and increases. Technical analysis often employs moving averages on charts, such as the weighted moving average (WMA), the simple moving average (SMA), and the exponential moving average (EMA). These indicators can be employed alone, in tandem, or in combination with other moving averages, such as the Moving Average Convergence Divergence (MACD).
Moving averages are significant because they allow analysts to foresee the possible course of an underlying. They are calculated by summing up all the data points for a given time period, then dividing that total by the number of time periods. For instance, in calculating the 5-day MA, an operator just has to add up the stock’s closing values over the previous five days and divide the total by five. When analyzing price movements, traders often look at the 50-day and 200-day averages. The appropriate midpoint between long- and short-term periods is typically considered to be the 50-day simple MA.
SMA’s, which represent the average closing prices of an asset over a predetermined number of days, are the most frequently used MA. Depending on the trading time horizon, SMAs may be employed as possible support and resistance indicators.
Types of Moving Averages
Simple Moving Average (SMA)
The moving average indicator which is most often employed in technical analysis is the SMA. It uses the values of the n-most recent periods divided by that same number of periods, for example, the sum of the price history over the last 5 days divided by 5 for a 5-day SMA. 50, 100, and 200-day intervals make up the common SMA. The 50-Day SMA, which is the most widely, used SMA variant, serves as a crucial level for charts of stocks and indexes. A popular MA indicator for identifying dip-buying chances is the 100-Day SMA.
The 200-Day SMA is a long-term trendline that is one of the most widely used indicators in any market. It is frequently seen as the final sign of significant support for bullish trends. The 200-day SMA is frequently used in swing strategies to time the entry and exit of positions.
Exponential Moving average (EMA)
The exponential moving average (EMA) is a technical indicator that may be used in trading strategies to determine trend direction or to hunt for a buy or sell signal. It is similar to the SMA, in that it measures price trend direction over time. The EMA gives more weight to more recent data and will track prices more closely than the related SMA. The EMA can assist spot patterns earlier than the SMA, but it will experience more short-term volatility than the SMA. When used to discover trends and corroborate recognized signals, the EMA is a helpful indicator since it may be used to analyze an asset’s price in terms of momentum, volume levels, or price volatility. The most common EMA time frames utilized by traders are 50-, 100-, and 200-day periods for the long-term line and 12-day and 26-day EMAs for the short-term line.
Weighted Moving Average (WMA)
The weighted moving average is similar to the SMA, except it prioritizes each preceding data with a different priority. This enables traders to develop bespoke weighting algorithms with non-linear distributions. It tracks prices more closely than a similar SMA and may be used to assist establish trend direction as well as to highlight support and resistance levels. All moving averages, including the WMA, are meant to identify trades with a delay at entry and exit rather than at the precise bottom or top. Because the WMA has a shorter latency than the SMA, it may be used to spot trends earlier than the SMA. It can, however, be a double-edged sword because it detects trends faster and experiences more whipsaws than a matching SMA.
Whipsaws or false breakouts are signals that give us a trigger to take a decision and after taking the decision the market goes against it. False breaks occur in all market conditions, but they are most common when a market is stuck in a trading range.
Pullbacks and crossovers
Crossovers are supposed to signify a shift in market momentum, and when the primary indicator crosses a specified signal line, the trader interprets this as a warning indication that something is happening with respect to the price action’s momentum or direction. Moving average crossovers occur when a faster-MA climbs above or falls below a slower one, and they may be beneficial for range trading as well as trend following. Many traders employ an SMA for the slower securities and an Exponential Moving Average (EMA) for the volatile securities.
A pullback is a retreat in price fluctuation that runs counter to the trend. It is a short-term price fluctuation before returning to the main market direction. The novice’s purpose in comparing prices is to discover the peak or bottom of price movement weakness.
Interpreting Moving Averages
Moving averages are often displayed a trendline and are used in capital markets to analyze stock prices and conduct technical analysis. Moving average indicators like the SMA, EMA, and WMA can help trader spots reversals in upward or downward movements. They are lagged indicators as they based on previous closing price data..
Golden cross
A golden cross is a technical indicator that indicates favorable market developments in the underlying. A golden cross is formed when the short-term MA crosses the long-term MA, signaling upward movement. This can cause a trend reversal or shift a long-term downward trend to an upward one. For example, when an asset’s 50-day MA exceeds its 200-day MA, the market shows a stronger buying power, and if asset volume climbs further, an upward breakout occurs.
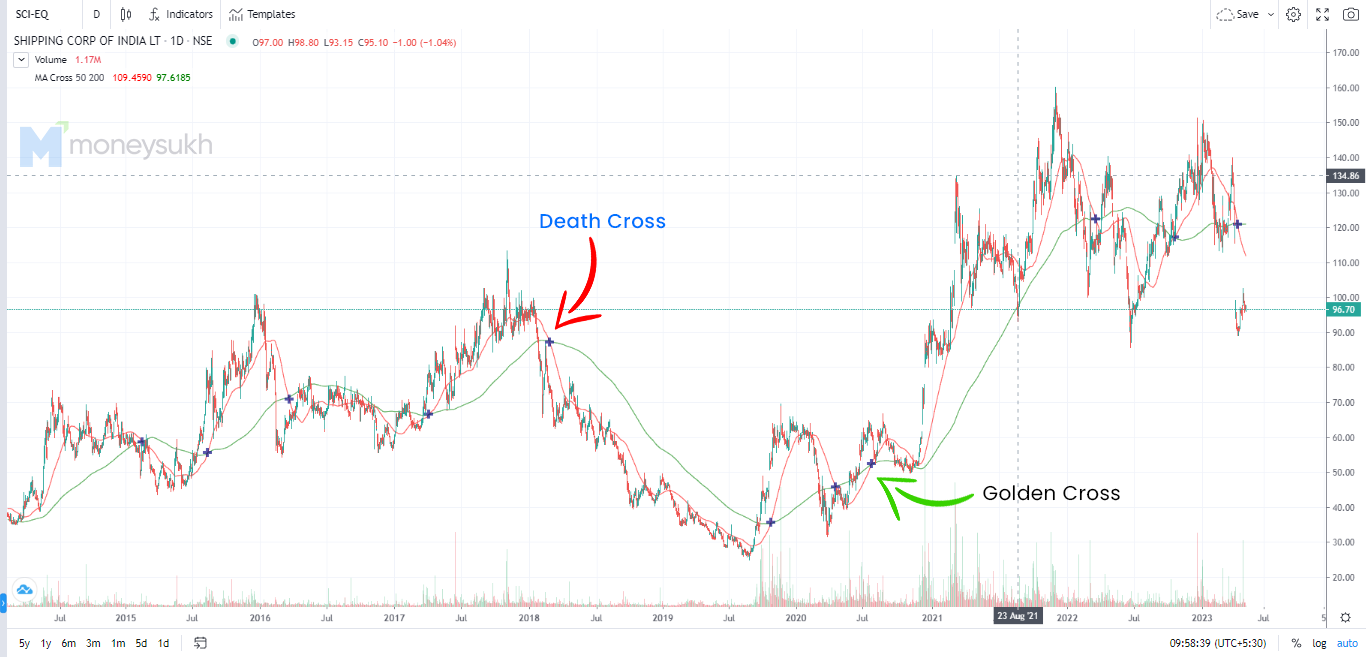
Death cross
A death cross is a type of Moving Average crossover that occurs when the short-term moving average line fall below the long-term moving average line. This dip in short-term MA signals bearish trends in the market and changes upward movement into a downturn. It triggers a sell-off indicating the price will fall as the investor sentiment toward the market turns negative.
MA -: Defined on basis of Days
200-day MA
The 200-day SMA is a long-term moving average used to evaluate the overall market trend. It is used in conjunction with other shorter-term moving averages to highlight and analyze market trends. It helps identify support and resistance points and indicates whether the trend is up or down.

100 day MA
Moving averages are technical indicators for price movements and is the average of closing prices of the previous 100 days or 20 weeks. It helps investors see how the stock has performed over 20 weeks and to find the price trend if it is upward or downward. If the MA trend line is seen moving up sharply, the market can be said to be bullish, though depending upon the time and volume, it may also mean that prices are nearing a peak and may soon see trend reversal and vis-a-versa. If the prices of securities are trading above the 100-day average, the market can be said to be bullish, if the prices are trading below the moving average, it is a bearish market.
50 day MA
The 50-day Moving Average is a reliable technical indicator used by investors to analyze price trends. To calculate the 50-day MA or 10 weeks, traders can add up the closing prices from the last ten weeks and divide the sum by the total number of days. It is an effective way for placing entry and exit points because it uses the price principle and does not break out easily. The 50-day MA is used by traders to test the bullishness of a particular stock when a stock’s short-term moving average surpasses the long term moving average say 200 day MA.
Best moving average for day/swing trading
The best moving average periods for day traders are 10d, 21d, and 50d. 10d is popular and fast-moving, 21d time frame is medium-term and accurate and 50d is long-term and best suited for identifying the longer-term direction.
Swing traders typically trade on the higher time frames and hold trades for longer periods of time. Therefore, swing-traders should first choose a SMA and also use higher period moving averages to avoid noise and premature signals. There are four moving averages that are particularly important for swing traders: 20d, 50d, 100d and 200d. The 21d is the preferred choice when it comes to short-term swing trading, while the 50d is the standard swing-trading moving average. The 100d is popular for support and resistance, and the 200d is popular on the daily chart since it describes one year of price action


No comment yet, add your voice below!