What is a candlestick?
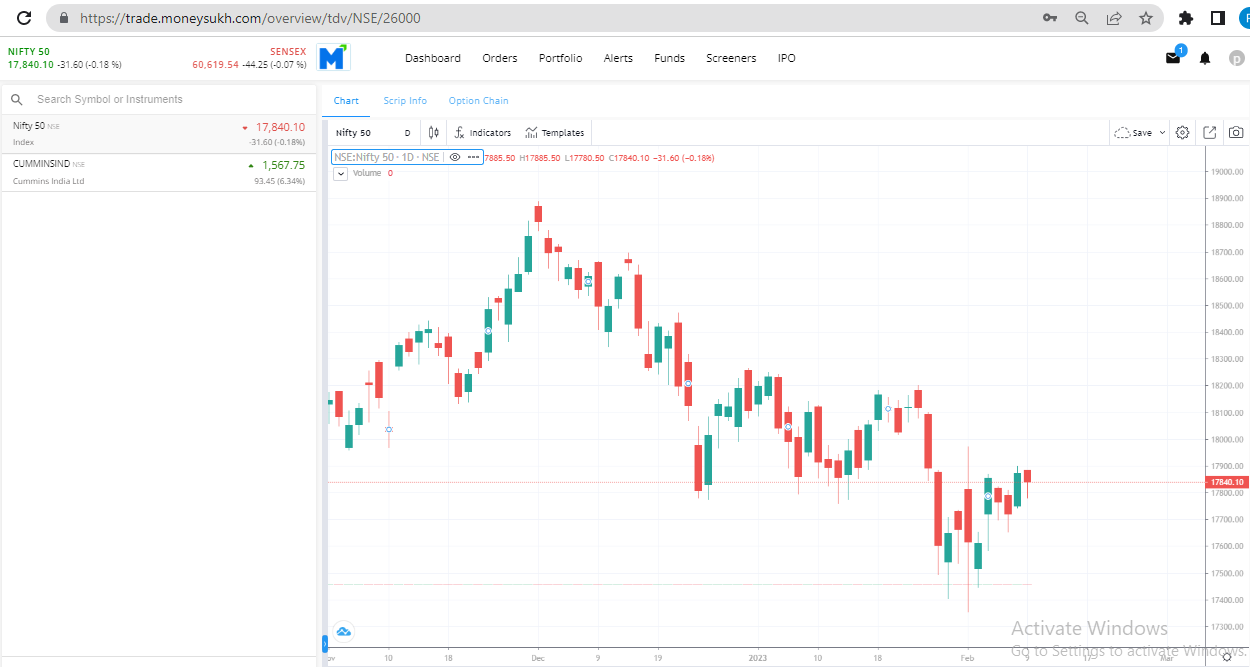
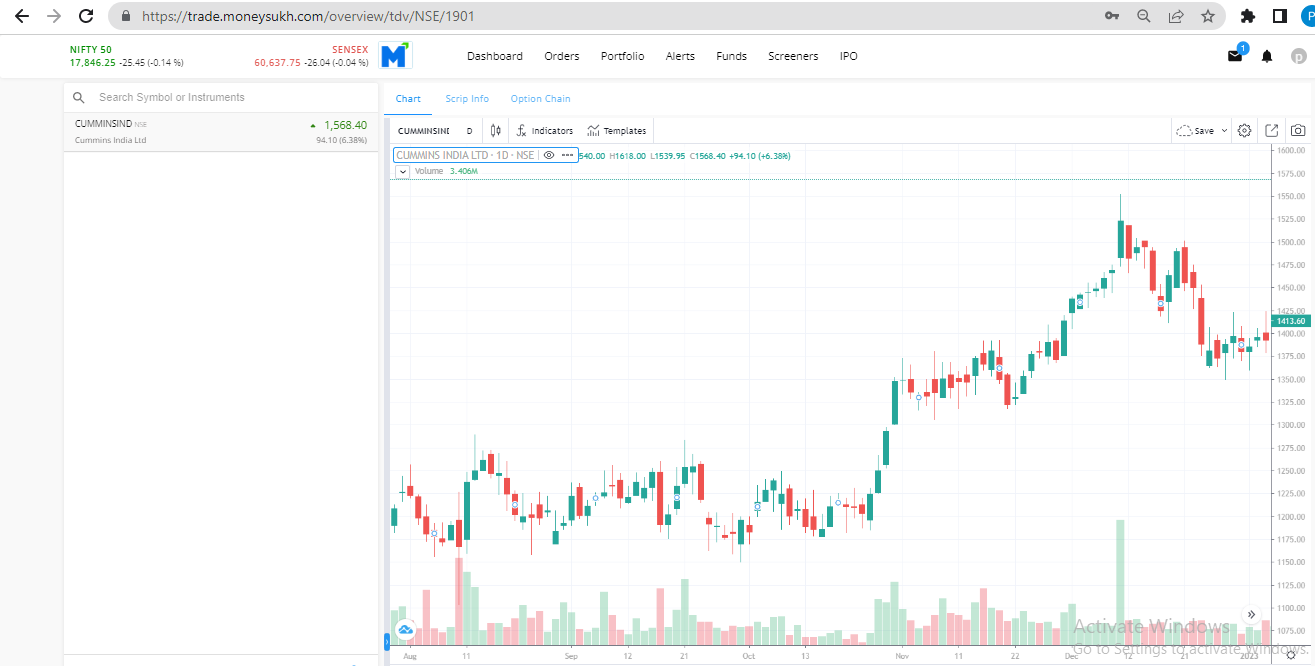
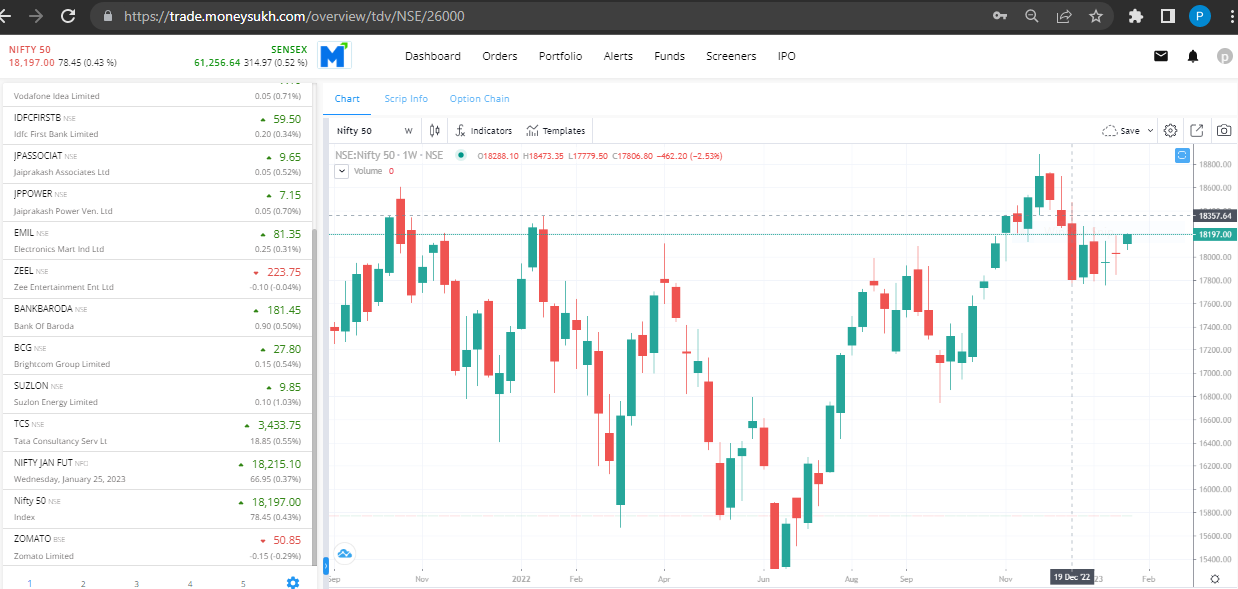
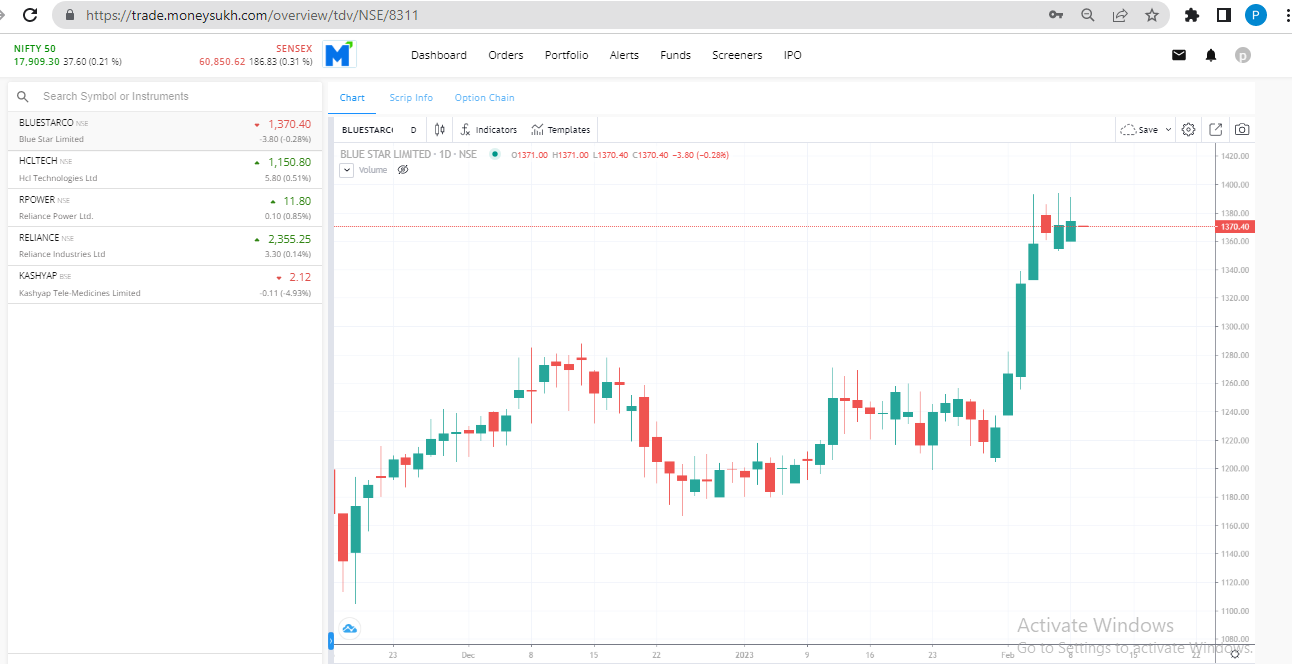
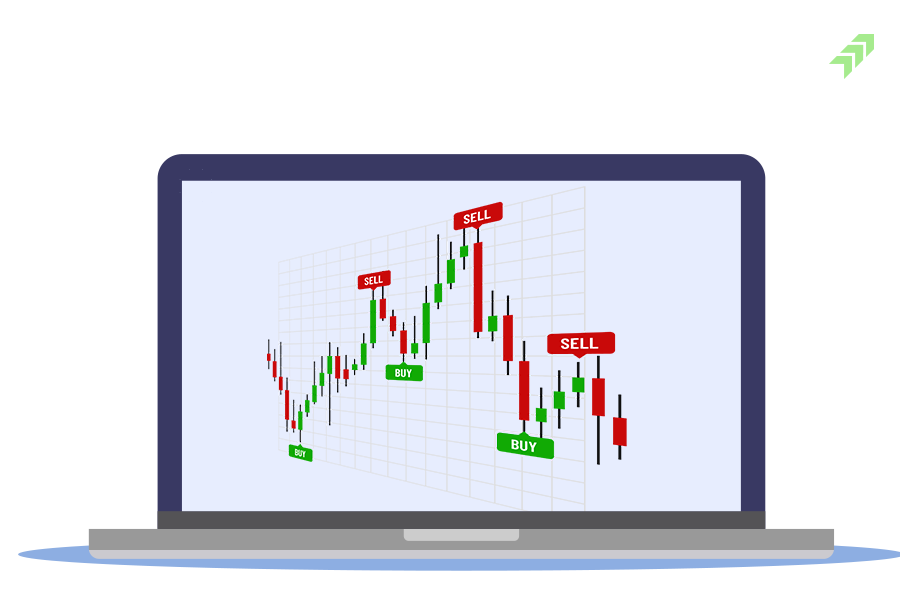
Candlestick chart patterns are a prominent component of technical analysis because they allow traders to evaluate price information rapidly and from only a few price bars. You may have seen colored, 2 sides pointed vertical rectangles bars on a stock price chart in your early learning phases. Those red/green or white/black bars known as candles in a Candlestick chart represent price fluctuations that occur throughout the time period. Candlesticks resemble vertical rectangles with wicks at the top and bottom for presenting information about the price movement of a security.
The color of the candle, together with the size of the wicks, reveals a lot about the candle's opening, closing, and price movement. If the color of the candle pattern is green, it signifies that the security's closing price for the day or particular time period was greater than the opening price, implying that the security's price has risen. If the color of the candle pattern is red, it signifies that the opening price of the security for the day or particular time period was greater than the closing price, implying that the price of the security fell. The distance between the top of the higher wick/shadow and the bottom of the lower wick/shadow represents the price range within the candlestick's time period. The "true body" is the widest component of the candlestick.
A candlestick has three basic features:
- Body, which represents the area between the opening price and closing price
- Shadow or Wick, that maximum and minimum price level that the security touched
- Colour, which reveals the direction of market movement
Over time, candlesticks in combination with other candle develop candle pattern that signal a market opportunity which helps traders/investors to drive important trend, reversals support and resistance levels, highlight continuation patterns, etc.
The best approach to learn to read, analyse, and comprehend the actual market picture using candlestick patterns is to practice entering and exiting trades based on the signals. However, it is crucial to remember that they should be used in conjunction with other technical analysis to support your overall trend thesis. By creating a Moneysukh account, you may practice your abilities in a risk-free environment. You can learn more about candlesticks and technical analysis with learn.moneysukh.com.
Let's go through the fundamentals of candlestick patterns and how they might help you make judgements.
Six bullish candlestick patterns
Bullish candlestick patterns form after a market downtrend starts to lose steam, and signal a reversal in price movement. They act as an indicator for traders, who believe that the price has bottomed and are considering opening a long position to profit from any upward trajectory.
Hammer
Hammer candlestick pattern is a single candlestick pattern that appears at the end of a downward trend and indicates a bullish reversal. It is one of the most reliable and widely used candlestick patterns. The pattern is used to identify capitulation bottoms….. Read More
Inverse hammer
Inverted hammer candlestick pattern is a single candlestick pattern. An inverse/ inverted hammer candlestick pattern often occurs at the end of a downtrend. It denotes a bullish reversal or a short-term downward trend reversal. … Read More
Bullish engulfing
For a bullish engulfing candlestick pattern to formulate there must be an ongoing downward trend. The engulfing pattern is the opposite of the harami pattern, except that the candle pattern cannot be the same color… Read More
Piercing line
Piercing candlestick pattern is formed near support levels and indicates a potential bullish reversal. This candle pattern is made up of two candlesticks, the first candlestick is a bearish and the second candlestick is a bullish. It’s a lot like the dark cloud cover pattern. The only distinction is that dark cloud cover indicates a bearish reversal, whereas a piercing pattern indicates… Read More

Morning star
Morning star candlestick pattern is opposite of the evening star candlestick pattern and it is a bullish bottom reversal pattern. It signals weakness in a downtrend, which could lead to a trend reversal. The morning star is made up of three candlesticks, with the middle candlestick forming a star. In the morning star pattern, the first candlestick must be red with a large real body… Read More

Three white soldiers
Three Advancing White Soldiers, also known as the Three White Soldiers candlestick pattern, is a trend reversal pattern. The Three White Soldiers generally signals a weakness in an established downtrend and the possibility of an uptrend forming. This pattern is the opposite of the three black crow candlestick pattern… Read More
Six bearish candlestick patterns
When the price of the underlying is rising in an uptrend and price signals a point of resistance, bearish candlestick patterns arise often. As the price of the asset rises, traders often square off their long positions to book profits. Soon after, emotions grow pessimistic, and traders initiate a short position to capitalise on the falling price.
Hanging man
Hanging man is a single candlestick pattern that appears at the top of an uptrend. This pattern is widely known among traders because it is regarded as a reliable tool for forecasting changes in trend direction. It is a bearish candlestick pattern that indicates that the market is about to reverse as the bulls appear to be losing steam… Read More

Shooting star
Shooting star pattern is a single candlestick pattern. It is a bearish reversal candlestick formation which has a small lower body and a long upper shadow. When the price is pushed higher and then immediately rejected lower, it forms a long shadow on the upside. The size of the shadow in general is twice the size of the body. The closing price should be close to the low of the candle…. Read More
Bearish engulfing
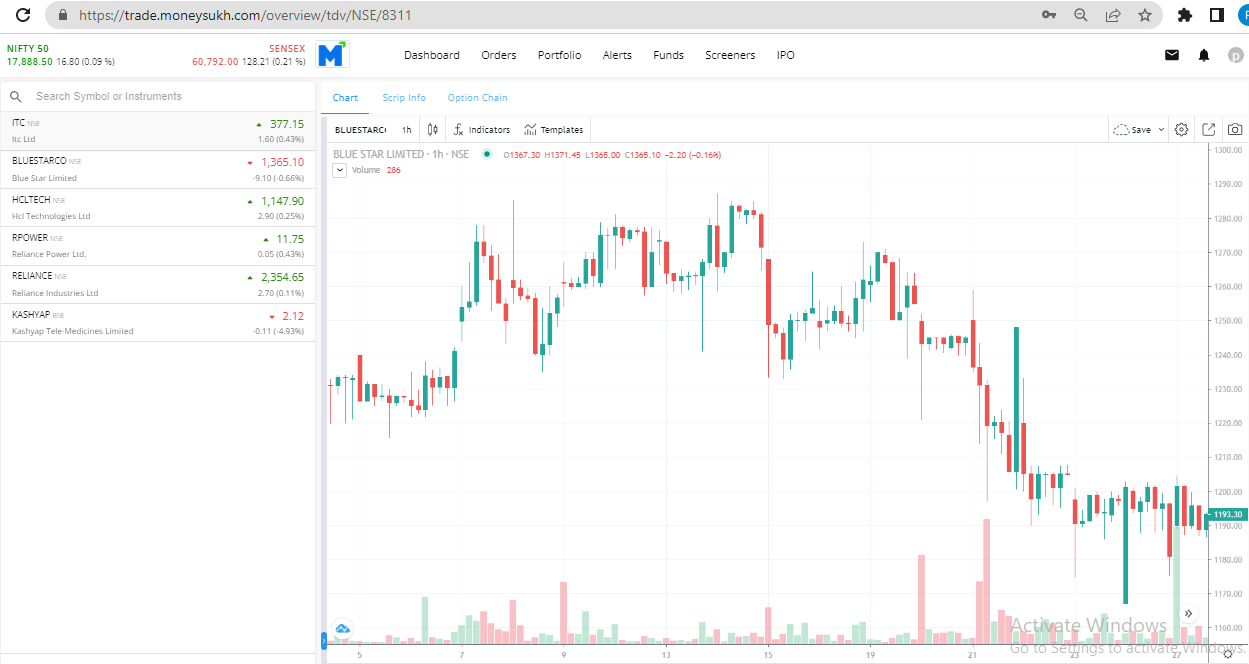
A bearish engulfing candle pattern can occur anywhere, but it is more meaningful after a price advance. A green candlestick is followed by a large red candlestick, which engulfs the smaller green candle. The preceding green candle maintains unassuming buyers’ optimism, as it should be near the top of an uptrend. The bearish engulfing candle will actually open higher, giving longs hope for another rise because it … Read More
Evening star
The Evening Star candle pattern is a candlestick pattern that appears at the end of an uptrend and signals the beginning of a downtrend. It is made up of three candlesticks: one large bullish candlestick, one small-bodied candlestick, and one bearish candlestick. When the evening star candle pattern is supported by volume and other technical indicators ….. Read More
Three black crows
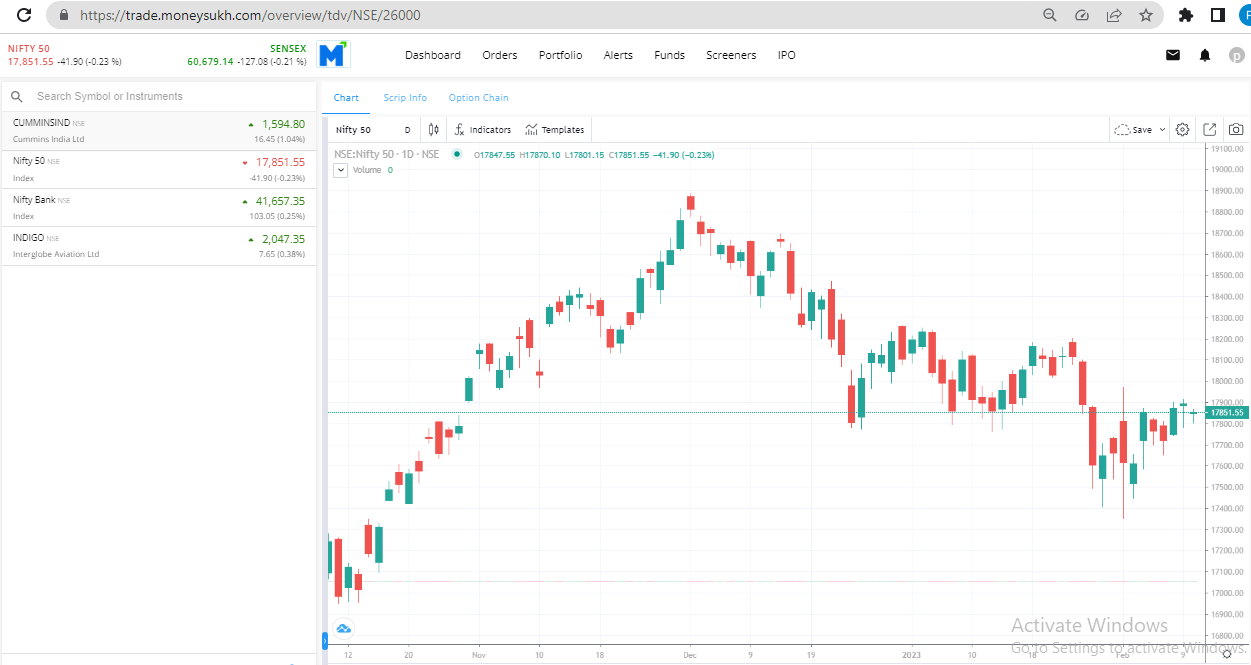
Stock market analysts use the term “three crows” to describe a market downturn. The three black crows pattern occurs when bears outnumber bulls for three consecutive trading sessions, resembling a staircase. Each candle should open lower than the previous day’s open, ideally in the middle of the previous day’s price range…. Read More
Dark cloud cover
The Dark Cloud Cover candle pattern requires a large black / red candle to form a “dark cloud” over the preceding rising candles. This is a three candlestick reversal formation in which the dark cloud cover candle makes a new high of the uptrend sequence as it rises above the prior candle close but ends up closing red as sellers step in early…. Read More

Four continuation candlestick patterns
If a candlestick pattern doesn’t indicate a change in market direction, it is what is known as a continuation pattern. These can help traders to identify a period of rest in the market, when there is market indecision or neutral price movement.
Doji Candlestick Pattern
A Doji pattern is a name for a session in which the open and close of a security’s candlestick are nearly equal and are frequent components in patterns. The Doji candle formed looks like the shape of a cross. Doji are neutral patterns that appear… Read More
Spinning top
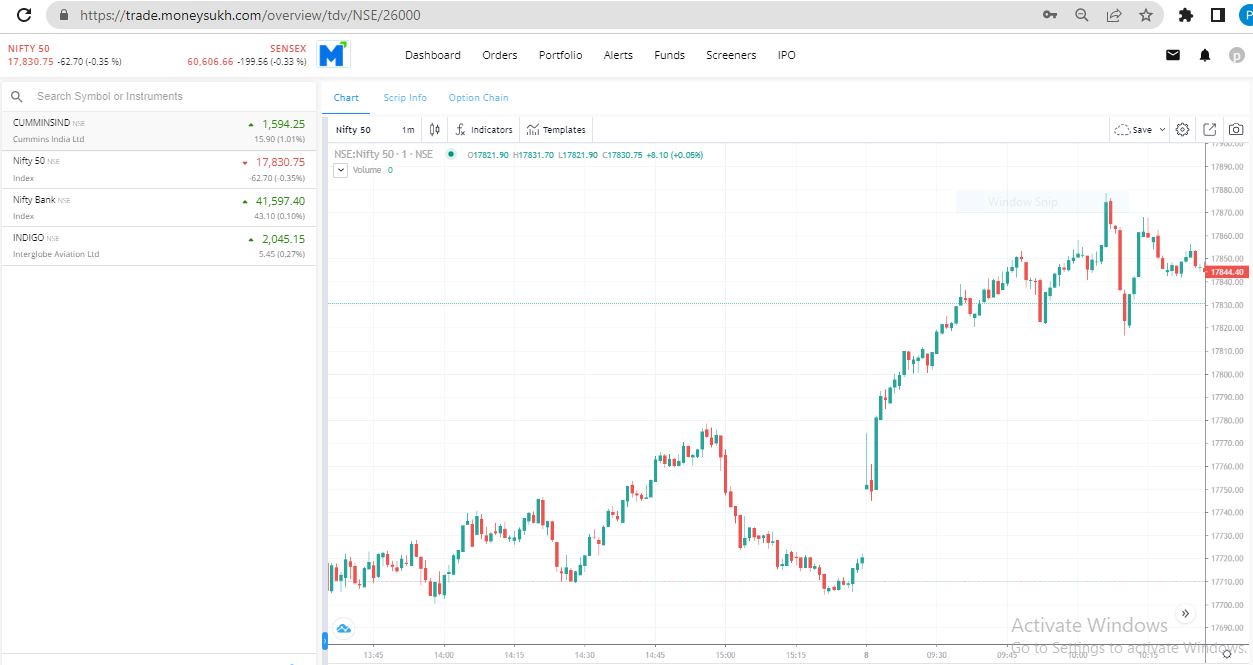
A spinning top candle pattern is a short real body and long upper and lower shadows that are vertically centered. The candlestick pattern represents uncertainty about the asset’s future direction. It means that neither buyers nor sellers will have an advantage. If the candle that follows confirms a strong price advance or decline, spinning tops can …… Read More
Falling three methods
Three-method formation patterns are used to predict the continuation of a current trend, be it bearish or bullish.
The bearish pattern is called the ‘falling three methods:
Falling three methods occurs when a downtrend slows down due to bears’ lack of conviction in continuing to drive the security’s price lower. This causes a counter-movement, which is frequently the result of profit-taking and, possibly, an attempt by eager bulls anticipating a reversal. The subsequent failure to make new highs or close above the opening price of the long down candle emboldens bears to re-engage, resulting in the downtrend resuming…. Read More
Rising three methods
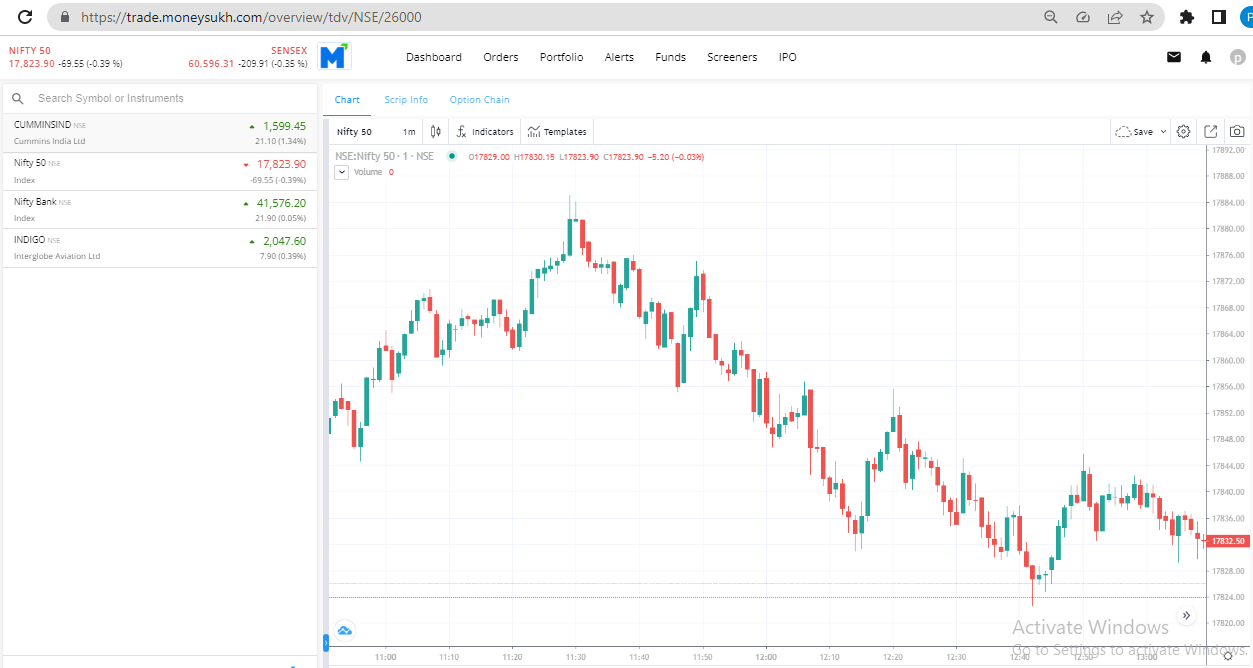
Three-method formation patterns are used to predict the continuation of a current trend, be it bearish or bullish. The bullish pattern is called the ‘Rising three methods’. Rising three methods is a bullish, five candle continuation pattern that indicates an interruption, but not a reversal, of the current uptrend. The pattern begins with a bullish candlestick with a large real body within a well-defined uptrend. Subsequent candlesticks, typically three consecutive bearish small-bodied candlesticks trading… Read More
Other candlestick patterns
- Marubozu Candlestick Pattern Has both bullish and bearish candlestick
- Tweezer Bottom Pattern Has both bullish and bearish candlestick
- Continuation Patterns – Determining a continuing trend
15 minutes Candlestick trading strategy for traders
Traders in the market must analyse several time frame charts to validate their buying/selling trading strategy. A day trader often prefers 5-min and 15-min charts to profit from larger price changes during trading hours.
- Step 1: Identify the Market Trend
Before viewing a small time frame chart, traders should be fully aware of the Knowing the dominating trend will make it easier for the trader to forecast movement by looking at candles. The dominant trend might be upward, downward, or sideways. It should be mentioned that the 5-min and 15-minute candlestick approach works best in a trending market.
- Step 2: Market Opening
A day trader's approach is based on market opening since the outcome is determined by the direction of market movement
- Step 3: Patience
The majority of the time, the reason why people fail in trading is a profit bias, even when they could have exited the trader with a minor loss. People tend to overlook market signals/ evolving patterns and become fixated on the idea that the market will reverse at any time. Many of the time they are right, and many of the time they are shown the mirror. People should be patient and wait for some strong signs before applying a strategy when none is functioning. Many times, underlying candlesticks might give misleading signals since the securities can quickly reverse direction, therefore a trader must wait for confirmation before entering a trade. Investors should priorities the eradication of emotions, particularly fear and greed.
- Step 4: Entry
Entering a trading position at the correct moment is critical, entering beforehand is even better and it is a skill that all traders must acquire. These candles serve as the starting point for the trade.
- Step 5: Target and Stop Loss
The biggest benefit of candlestick analysis is that it simplifies the price visualisation of a security at any time frame, be it 5 min or quarterly chart. The easy to eyes visualisation of a price would transform a strong trading possibility into a bad transaction. Candlesticks often throw signals a formation of a bullish/bearish pattern. When buying security, one should normally set a stop loss at the low of the most recent candlestick. Likewise while selling the security. One disadvantage of relying just on candlestick patterns is that they do not indicate prospective price goals.
FAQ:
Can Candlestick Patterns Predict Market Turning Points ?
There is no one go-to place for accurately forecasting trend reversals, although some candlestick patterns are employed to achieve that.
How is candlestick chart different from a bar chart ?
The candlestick chart is not the same as the bar chart, although they do have certain similarities in that they both display the same amount of price data. Most traders, however, believe that candlestick charts are simpler to interpret.




9 Comments
[…] Also read: Candlestick chart patterns […]
[…] of charts for trading as per their ease and applicability. Though, most of the traders use the candlestick charts to understand the patterns of the stock movement and can apply the best indicators for the right […]
[…] technical analysis, certain tools and techniques help to identify the stocks having potential. Candlestick chart patterns, RSI, Moving Averages, Bollinger Band, Volume Analysis and similar many more indicators are used in […]
[…] technical indicators such as candlestick chart patterns, support and resistance, RSI, Moving averages, Bollinger band, Fibonacci Retracements and Swing […]
[…] trading in the market daily. Yes, the tools, techniques and indicators all can be used on candlestick charts of any instrument including equity, commodity, currency and cryptocurrency that are traded in the […]
[…] of support and resistance and use the same for price action analysis of the chart patterns like candlestick patterns and confirm the trade […]
[…] technical analysis, various tools and techniques like examining the formation of candlestick charts, RSI, Moving Averages,Bollinger Band, and Fibonacci Retracementare used to analyze the stocks […]
[…] the candlestickchart patterns, if traders start buying new stocks from the purchasing stocks after the lows, it doesn’t […]
[…] Trading is possible with the help of technical analysis tools, and techniques like analyzing the candlestick chart patterns, and drawing the technical indicators on charts helps to know where you have to book partial […]