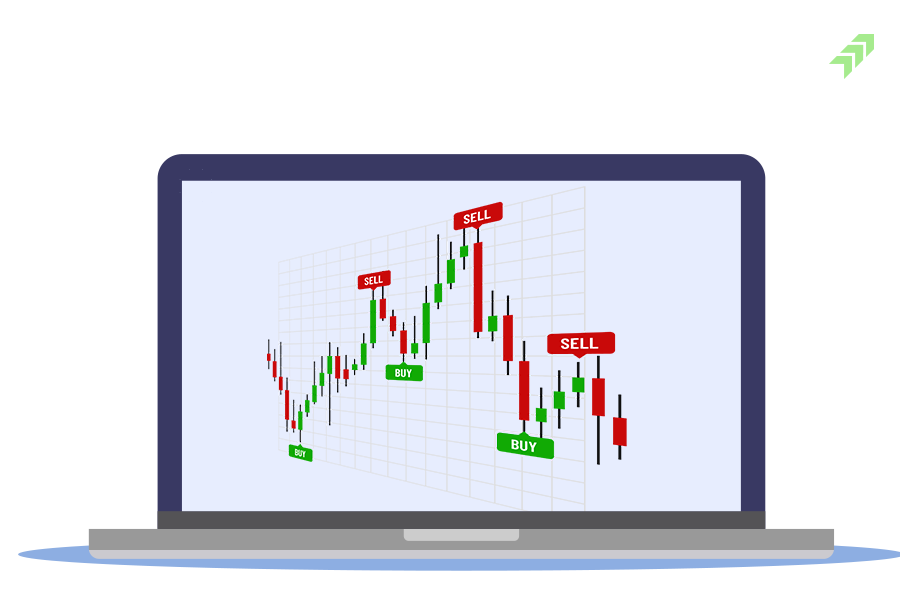
Trading in stock market is not profitable without applying the certain tools & techniques that is possible only when you analysis the stock price or market index on a technical chart. Merely price movement or chart patterns are not enough to analysis and predict the movement, here you need to use certain technical analysis tools, and RSI Indicator is one of them.
What is RSI in Stock Market?
RSI full form, Relative Strength Index is one of the most commonly used technical indicators traders use to check whether a stock or market index is overbought or oversold zone. RSI oscillates between zero and 100 and when RSI Indicator is above 70,it is considered in the overbought zone and when RSI Indicator is trailing below 30 it means the stock is oversold.
The relative Strength Index indicator has been created by J. Welles Wilder Jr. and announced in his formative book1978, New Concepts in Technical Trading Systems. RSI Indicator is directly proportional to the price, which means if the RSI increases the price also increases, and if the RSI decreases, it means the price of a stock also decreases. Here you need to understand more about Relative Strength Index and its applications in stock market trading.
How RSI is Calculated?
RSI calculation is not complicated, instead very easier to understand. The relative Strength Index has three basic components, RS, Average Gain and Average Loss. Relative Strength Index calculation is based on 14-day periods which is a default number of days suggested by Wilder in his book.
In this calculation, losses are stated as positive value, not negative values. Starting the calculations the average gain and average loss are simple 14-day averages.

RSI Formula
First Stage RSI Calculation: Average profit and average loss are simple 14-day averages.
- First Average Profit = Sum of Profits over the past 14 periods/14.
- First Average Loss = Sum of Losses over the past 14 periods/14
Second Stage RSI Calculation: Based on the previous averages and the recent gain loss.
- Average Gain = [(previous Average Gain) x 13 + current Gain]/14.
- Average Loss = [(previous Average Loss) x 13 + current Loss]/14.
The Relative Strength Index is calculated with the standard number of periods of 14. However, there are three different approaches commonly used while calculating the RSI Indicator. Simple Moving Average, Exponential Moving Average, and Wilder's Smoothing Method.
How RSI Indicator Works?
RSI stock means, as a momentum indicator that compares the strength of the stock on the days when the prices of stock move up to its strength on days when prices of the stock go down. When Relative Strength Index is above 70, it is considered overbought and when remains below 30, it's in the oversold zone. However, if the stock is highly volatile and repeatedly reaches overbought levels, then you can adjust the level above 70 and watch the stock. But adjusting the overbought or oversold RSI Indicator levels is not required if the price of the stock trading in the long-term horizontal channel instead of a one-sided trend. RSI Indicator is not reliable in a single trending market most traders consider signals given by the RSI Indicator in robust upward or downward trends can give wrong signals.
How to Use RSI Indicator?
As we already told you Relative Strength Index stays between the standard RSI values it indicates certain trends. If Relative Strength Index stays above 30 and frequently crosses 70 it means there is a strong uptrend. While in the strong downtrend, Relative Strength Index remains below 70 and frequently crosses 30.
Using the RSI indicator you can interpret the trend of the market or stock. As per the rules, if RSI Indicator is in the oversold zone you can buy the stock and sell if hovering in the overbought zone. But in both cases reversal of the prior downtrend/down to buy and reversal of the prior uptrend/up move should be observed closely to sell the stock.
How to Read and Understand RSI Indicator?
Reading or understanding the RSI indicator you don't need specific knowledge and skills. There are two ranges upper side and the lower side you just need to check whether Relative Strength Index is trading around which levels. Let’s remind again when RSI Indicator is greater than 70, means the stock is overbought. And when RSI Indicator is below 30 it means the stock is in an oversold zone.
In an overbought situation, traders can incur losses if not sell the stock, while in an oversold zone, traders can enjoy profits if they buy the stock at this level. Though, the RSI Indicator Index can be a very helpful indicator for anyone looking to make positions in stock trading.
RSI Divergence Indicator
The RSI divergence happens when the price moves in the opposite direction of the Relative Strength Index. Or you can say the indicator on the technical chart starts showing the change in the momentum before the equivalent change is visible in the price of the stock. And usually, two divergences occur when the Relative Strength Index divergence indicator works, let’s find out what are those.
Bullish Divergence RSI: Bullish divergence occurs when Relative Strength Index shows an oversold level followed by a higher low that appears with lower lows in the price. At this point, the stock can rebound from the oversold zone which could be the best opportunity to make long positions in the stock.
Bearish Divergence RSI: On the other hand, a bearish divergence occurs when Relative Strength Index displays overbought levels that are followed by e lower high that appears with higher highs on the price of the stock.
A bearish divergence occurs when the Relative Strength Index creates an overbought reading followed by a lower high that appears with higher highs on the price. At this point, traders should take quick action and book profits before the stock goes down.
Why RSI is Important?
In the technical analysis, RSI Indicator is playing a crucial role in showing the strength of buying or selling zone of the stock. RSI Indicator, apart from showing the overbought and oversold zone, there are certain things Relative Strength Index can be very helpful in finding the trading related other things. Apart from showing the strength of stock in a particular zone, RSI Indicator has various other applications listed below.
Importance of RSI in Trading:
- RSI Indicator shows whether the stock is overbought or oversold.
- For short-term traders, RSI Indicator gives buy and sell signals.
- RSI Indicator can be used to predict the price behavior of the stock.
- A bullish failure swing forms when RSI is below 30 and bounces back.
- RSI helps in validating the trends and trend reversals for the traders.
- RSI stock above 50 shows an uptrend, and below that shows a downtrend.
- Advanced breakout and advanced breakdown can be also seen in the RSI.
- Shows a Trend line like an uptrend or downtrend that can be drawn using the RSI.
- RSI divergence positive, negative, reversal any other pattern shows at breakout.
- RSI can be also used with other technical analysis tools to support trading strategies.
Also read: Technical Indicators that Every Trader should be aware of
Conclusion: Is RSI the Best Indicator?
Is Relative Strength Index a good indicator? Yes off course, RSI is one of the most popular tools for trading in stocks, cryptocurrency, forex and future or options. But it is not indicators that makes user confident to apply every time or solely while applying the buying or selling strategies.
Basically, the RSI stock measures the price momentum of the stock and the main motive of using the RSI Indicator is how traders are taking quick actions in biding the price of the stock up or down. RSI indicators show this with the range of 0 to 100, in which readings RSI Indicator below 30 usually indicate that the stock is oversold, while RSI Indicator above 70 indicates the stock is overbought.
However, it is not necessary to buy the stock if Relative Strength Index is low, as if any stock is downtrend it might continuously trade below 30 for many days. In such situations, traders should wait for the trend reversal and use other technical indicators to confirm the buy signal.


No comment yet, add your voice below!