


In technical analysis, there are various tools and techniques used to analyze the chart and price movement of stocks. These tools and techniques help traders to know the buying and selling signals, or where they have to pick the stocks and book the profits.
Fibonacci Retracement is one of them not widely used but one of the very important and interesting tools used by traders globally. Today we will discuss Fibonacci retracements, and how their levels are used for trading with tools, settings and strategies.
What is Fibonacci Retracement?
Fibonacci Retracement is a method of determining the support and resistance levels of a stock or any indices in the stock market. And these levels are discovered by measuring the vertical distances between low and high points of the stock’s price, later that is also divided by the key Fibonacci ratios that are known as 23.6%, 38.2%, 50%, 61.8%, or 100%.
How Fibonacci Retracement Works?
Fibonacci Retracement works on certain levels that are calculated through a formula. Every level is related with the percentage that is how much of a previous move the price retraced. The Fibonacci retracement levels are 23.6%, 38.2%, 61.8%, and 78.6% used to check the level of correction or how much percentage of stock is likely to retrace.
Looking at the Fibonacci Retracement drawn on the chart, you have to choose two points – one would be a high price point and another should be a low price point. And make sure there are no higher highs and lower lows because if you identify the wrong, your calculation will be not right and retracements levels will not come out correctly.
How are Fibonacci Retracement Levels Calculated?
Fibonacci numbers were originally calculated based on a mathematical model that has been derived centuries ago. It has been created from a ratio that is driven by the Fibonacci sequence discovered in the early 1400s by an Italian mathematician.
The Fibonacci ratios are percentages of a selected price range that determines the support and resistance levels of the price movement.
These ratios were derived from the Fibonacci numbers – that is a sequence of numbers where each number is the summation of the previous two. When you divide a Fibonacci number by the next number, the result will be 0.618 (61.8%). And If you divide the same digits by the second number to its right, you will get 0.382 (38.2%), and then 0.236 (23.6%).
Fibonacci Retracement Examples
To make it clear how Fibonacci retracement is calculated, let’s take an example that will help you understand better.
Suppose a stock price increases by Rs 10 and then drops Rs 2.36, here it has retraced 23.6% which is the Fibonacci number. Similarly, other levels are calculated and checked while using the Fibonacci Retracements as a technical analysis tool.
To find the Fibonacci levels let’s take another example, assume a stock trading at Rs 100, and after a few days the price rises to Rs 150. Here to plot the retracement levels, you have to first find the difference between the high and low prices – Rs 150 – Rs 100 is equal to Rs 50.
Now you have to multiply this difference by the Fibonacci ratios (0.382, 0.5, and 0.618) and add these results to the low price.
Rs100 + (Rs50 x 0.382) = Rs119.10 (38.2% retracement level)
Rs100 + (Rs50 x 0.5) = Rs125 (50% retracement level)
Rs100 + (Rs50 x 0.618) = Rs130.90 (61.8% retracement level)
Now these levels are plotted on the chart horizontally and used as potential areas of support or resistance. If the price of the asset were to retrace and reached any one of these levels, traders use these levels to enter a long short position, as per the market trend and direction of the stock price movement.
How to Draw Fibonacci Retracement?
Drawing the Fibonacci Retracement levels on the chart is not that difficult if you have the real-time data of stock and tools on the chart to draw retracements. It is a trend line drawn between two significant points, typically between the lowest and highest, plotted on a chart. It is just intersecting horizontal lines that are placed at the Fibonacci levels.
First of all, find out the immediate peak and low and select the Fibonacci retracement tool from the chart tools.Now connect the peak and low using the Fibonacci retracement tool. Using the tool you have to click on through first and without un-clicking, just drag the line till the peak.
Fibonacci Retracements Levels on Chart:
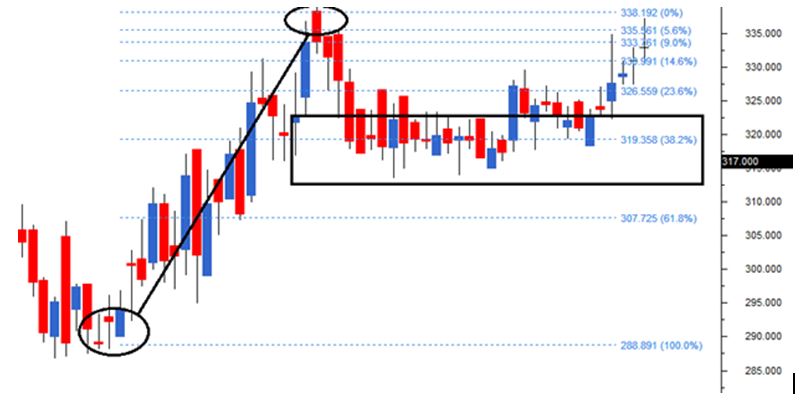
However, while doing this, at the same time, Fibonacci retracements levels will be plotted on the chart. Though, the chart drawing tool on software completes the retracement identification process only after selecting both the trough and the peak and how the chart looks like.
Fibonacci Retracement Settings
We have already told you in the previous para while discussing Fibonacci Retracement. But let us repeat, the most commonly used Fibonacci retracement levels are 23.6%, 38.2%, 61.8%, and 78.6%. However, 50% is also a common retracement level, but it is not derived from the Fibonacci numbers, so it is usually not considered in settings.
The right settings and accurate Fibonacci retracement levels help to predict the market movement precisely. Though, as per the experts, Fibonacci retracements can forecast about 70% of market movements, especially when a specific price point is forecasted. While, some experts say that Fibonacci retracement levels are a psychological comfort zone, relatively more than solid resistance levels.
How to Use Fibonacci in Trading?
The main motive of Fibonacci Retracementis to use it in trading and book maximum profits with the right predictions of stock movement. Here below we have listed the best use of Fibonacci Retracement in trading with an example.
Identify the Highs & Lows: The most important use of Fibonacci Retracement in trading is it helps to identify the high and low points of any stock or indices.
Support & Resistance: When the price of any stock retraces after rising a few days, Fibonacci levels help to find out the potential support and resistance in stocks.
Also Read:What is RSI in Trading & How RSI Works? Formula and Strategy
Fibonacci Retracement Levels: The most important use of Fibonacci in trading is to draw the retracement levels on a chart between the high and low points. These levels are derived from the Fibonacci sequence which includes 23.6%, 38.2%, 50%, 61.8%, and 100%.
Taking Decisions to Trade: Last but not least, the most significant use of Fibonacci is to make the right decision for trading. After identifying the support and resistance to draw theRetracement levels you find out the suitable point to buy or sell the stocks.
Also Read: What is Breakout & Breakdown How to Identify Breakout in Stocks?
Fibonacci Retracement Strategy
In technical analysis, Fibonacci Retracement levels are used as a trading strategy to take the right decisions and make the trade profitable. If retracement is happening within a trend, then Fibonacci levels indicates to put the trade orders in the direction of the ongoing trend.
Fibonacci levels are very useful, if traders looking to buy any particular stock but missed the uptrend. In such a situation, you can wait for the pullback. Here, by plotting the Fibonacci ratios like – 61.8%, 38.2% and 23.6% on a chart you can easily identify the best possible retracement levels and decide to enter the potential trading positions in that stock.

Fibonacci Retracement Trading Strategies:
Fibonacci with MACD: Fibonacci retracement lines can be used with the combination of Moving average convergence/divergence (MACD) indicators to look for the crossing over. Here in this strategy when a stock’s price, reaches an important Fibonacci level and when this happens, a position can be made in the direction of the trend.
Also Read:Swing Trading Strategies Indicators & Best Stocks
Fibonacci with Stochastic Indicator: When Fibonacci levels are used with a stochastic indicator the two-line indicator can help to find the overbought and oversold levels. It gives the key signals from the stochastic indicator when the price reaches the Fibonacci level. The combination of these two signals indicates to make an open position in the stock.
Also Read:Bollinger Bands: Indicator, Strategy, Settings& Analysis
Fibonacci with Chart Timeframes:Fibonacci retracement levels can be also used as multiple timeframes, especially for longer timeframes. For example, using the 38% retracement on a weekly chart is more suitable for technical levels, compared to 38% retracement on a five-minute chart.
Fibonacci for the Price Analysis: Fibonacci retracements can be used with the other indicators and combinations of price analysis. Here traders may use the Fibonacci retracements to find the potential levels of support and resistance and use the same for price action analysis of the chart patterns like candlestick patterns and confirm the trade setup.
Also Read: Nifty Open Interest: How Traders Use Change in Nifty OI for Data Analysis?
Using Fibonacci retracement levels with other technical tools within a broader strategy. Similarly, using the combination of other indicators with Fibonacci offers a better chance to precisely identify the market trends, and maximize your profits. However, there are a few limitations of Fibonacci retracement too that make it not popular among a few traders.
Limitations of Using Fibonacci Retracement Levels
Every tools and techniques have its drawback. Fibonacci Retracement also has limitations when used practically in real life for trading. Before you start using the Fibonacci Retracement in your trading strategy to make decisions check the limitations.
Indicates Only Static Price Levels: As per a few experts, Fibonacci retracement indicates only static price levels. As certain stock prices may go beyond or stay below the predicted levels.
Analyzing the Irrelevant Factors: While using the Fibonacci Retracement, various unnecessary factors are also used to consider the price of the stock. These factors are taken into account while forecasting the future price of the stocks.
Difficult for the Stockbrokers: As the Fibonacci retracement levels are very close to each other, it usually makes it difficult for the leading stockbrokers to define the accurate platform to use this tool and predict the future price of the stock.
Summing-up
For traders, Fibonacci retracement can be one of the best tools to determine the entry and exit points while trading in any stock. The best use of Fibonacci retracement is that it allows the traders to forecast the accurate support and resistance levels before the price touches the same.
You can analyze the formation of the candlestick with retracement levels, the action of the price at levels and support & resistance with volume at this retracement level. Along with these factors and other fundamental aspects, it helps to construct a clear indication of where the stock is heading or take the right decision for selling and buying the stock.
Nevertheless, it is not easy to use the Fibonacci retracement levels to predict stock movement accurately. As you need complete knowledge of technical indicatorsanalysis and various other tools and techniques used to analyse the stocks.
Also Read: Technical Indicators that Every Trader should be aware of
Technical analysts have such knowledge and experience, to use such tools and techniques efficiently and make the right predictions in the stock market.
Here, you can take help from such experts or opt for the services offered by the broking house, where technical analysts use advanced software and tools to draw and use the Fibonacci retracement and similar techniques to analyse and forecast the price movement of the stocks and recommend the same to the clients and help them earn profits.
Broking houses have all the infrastructure and required facilities to conduct stock research and analyze the next move of stock to make the right decisions. Moneysukh is one the leading broking house in India and offers all-in-one services with an online platform for Equity, Commodity and Currency trading to HNIs and retail clients at the lowest broking charges.
Moneysukh offers tips for intraday trading as well as for long-term investment backed by a team of highly qualified and experienced research analysts who use the best tools and techniques to analyse stocks for trading and provide daily recommendations on client’s phones with quick updates to book profits or exit from any stock position profitably.


No comment yet, add your voice below!