


Tradingview is one of the most widely used software to see the price of stocks in a chart form. You can see the updated price data with live feeds of all types of information related to stock prices. Nowadays most of the stock brokers in India and globally are using TradingView for charting and performing fundamental analysis and technical analysis.
Also Read: Why is Fundamental Analysis Important for Investing in Stocks
However, using the TradingView chart is not easy for everyone unless you have the technical knowledge of the stock market and the skills to apply and use the various tools and technical indicators. Multiple functions are integrated into the TradingView chart that you can use to analyse the movement of stock helping traders to make the right decisions in trading.
Also Read: What to Know Before Investing in Stocks: 10 Things to Consider
The TradingView chart opens with default settings when you select any stock or index, and you can see the price movement of the stock or any other financial instrument plotted on the line chart with the price range on the right side in the vertical bar, while at the bottom on the horizontal bar, you can see the duration of the price movement of the same stock in days.
Also Read: What is TradingView& How to Use it for Trading
However, this is the default setting of the TradingView chart, but you can set, adjust or rest and use the charts and other data in different formats and time durations. Using the TradingView chart settings correctly can give the right indication or price movement. So, today here in this article we tell you how to set up, use adjust and rest the TradingView Chart and cover other topics to help you set up the TradingView chart in an efficient manner.
How to Set Up TradingView Chart?
The TradingView chart opens when you open any stock to see the market-related data and other financial details. The chart in TradingView automatically opens with a live chart showing the few days’ price movement of the stock or the selected instrument.
Here you can set up the TradingView chart as per your customized needs and preferred settings to perform the technical analysis. You can choose the theme or appearance and scales as per your preference with options to apply the indicators. Below you can find the best tradingview chart settings that you can set up while using this chart system.
Choosing the Symbol: To see the chart of a stock or any other instrument first of all you have to select the symbol that you can type in the search box. You can just type the name of a listed company and can see all the symbols resembling the name, but you can select the one you are looking for. Once you select the chart will be visible in Area chart format.

You can see the chart below that shows the Symbol section under the chart settings, and you can choose to change the colour of the candlestick or line chart. This section will also allow you to adjust the shades, and change the colour of the candle’s borders and wicks with the option to show or hide and change the color of the last price line or high and low price lines. Here you can change the precision levels of chart data and also choose the time zone as per your location.
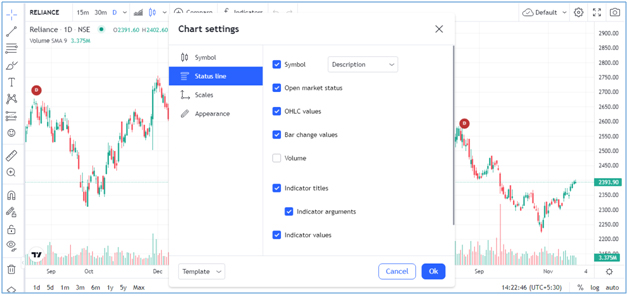
Set up the Status Line: To set up the status line, navigate to the top right corner and click on the icon of settings to open the chart settings. Here you can choose to show the symbol name with the ticker, or only the description or show the ticker with description. As shown in the image below you can see the options to select and unselect to show or hide the open market status, OHLC values, bar change values, volume, indicator title, arguments and indicator values.
Selecting the Scales on Axis: The scales tab under the chart settings will give you the option to change the values or information showing on the X and Y axes. See the image below showing how you can select or unselect to show the symbol name label, and symbol last price with options to show price and percentage value or value according to the scale on the Y-axis.

Apart from that you can also select the high and low price labels, indicators name labels, indicators values labels, no overlapping labels, countdown to bar close and lock to bar ratio. Furthermore, you can find the option to switch the placement of scales on the left side or right side and change the format of the date as per your choice and understandability.
Change the Chart’s Appearance: This section under the chart settings of TradingView will allow you to customize the appearance of the chart. As the image of a chart is shown below for reference, you can do from changing the background colours of the entire chart to selecting the navigation and pane buttons, you can customize the chart as per your preference.

Apart from that you can also change the style and shades of the Vertical and horizontal grid lines and session breaks. You can also increase the size of the data and chart here using the Scales Text option and also can change the colour of scales lines or crosshairs. You can insert the watermark for the time frame and change the navigation and pane buttons.
Additionally, using the appearance section you can also increase decrease or adjust the margins of the chart area and data by selecting the options like top margin, bottom margin and right margin. This section is very useful and provides you full control over the appearance of the chart with the options to change the colors of various sections or adjust the font size etc.
Selecting the Type of Charts: As we have already told you whenever you open the TradingView software to see the chart, it will show you the area chart type. However, you can change or choose other chart types from the chart section as shown below in the image.
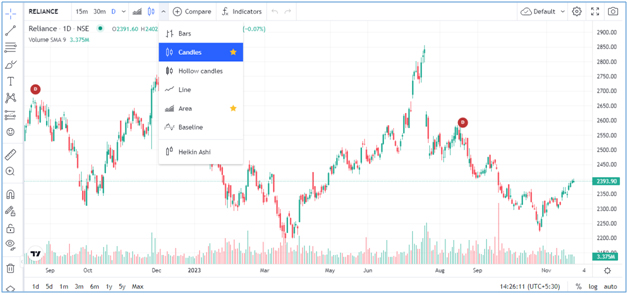
Here you can select from multiple chart types like Bars Chart, Line Chart, Area Chart, Baseline, HeikinAshi, Hollow Candles and the most popular one the candlestick chart patterns.
Also Read: How to Read, Analyse& Use Candlestick Chart Patterns for Trading
Selecting the Type of Cursor: As soon as the chart loads on TradingView you can choose the type of cursor from different options given at the top left corner of the chart panel. As the image shows below you can choose the cursor type like cross, dot, arrow or eraser.

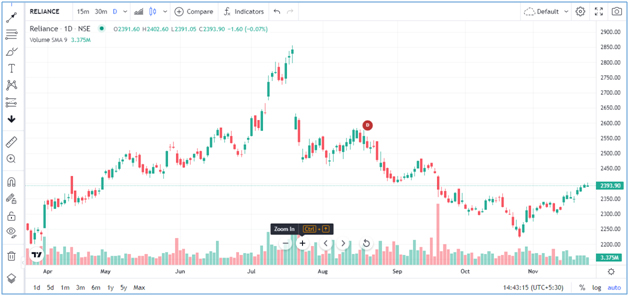
Selecting the Time Intervals: This is one of the very important sections, especially for intraday traders, who switch the price chart between the different time intervals. As you can see the screenshot image of the daily chart of Reliance Industries on TradingView with the options to show the chart, on a monthly, weekly daily and hourly basis.
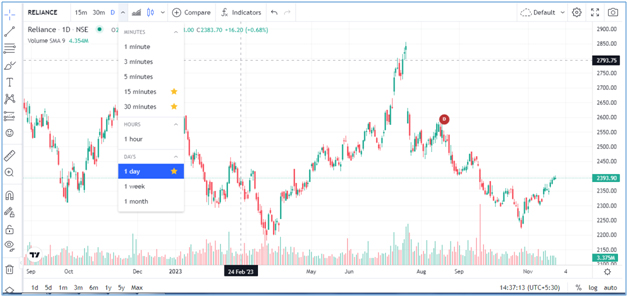
From half an hour to one minute, you can select the time to see the chart showing the price movement within the same intervals.
Also Read: How to Select Stocks for Intraday: 10 Tips to Pick Best Stocks

Set up the Volume on Chart: Along with the price chart, you will also see the volume chart at the bottom of the chart panel that will be also loaded by default when you select any stock to see the chart in the TradingView. You can find the volume settings option at the top left side just below the symbol of the script with the default setting of showing 9-day SMA.

As the image showing above of volume settings in TradingView, you can select the settings icon on volume and can see a popup window showing the options to customize the volume chart. Here you can change the inputs, style and visibility of volume with the options to change the colour, smoothing line and length or length and types of the moving averages.
Also Read: Importance of Volume in Technical Analysis: Use & Role in Trading
After adjusting the inputs you can go to the style section where you can choose the types of volume chart like line, bar, area or columns as per your preference. While under the visibility section, you choose to show the volume chart from minutes to hours, days, weeks and months with the option to change the parameters of each duration of volume.
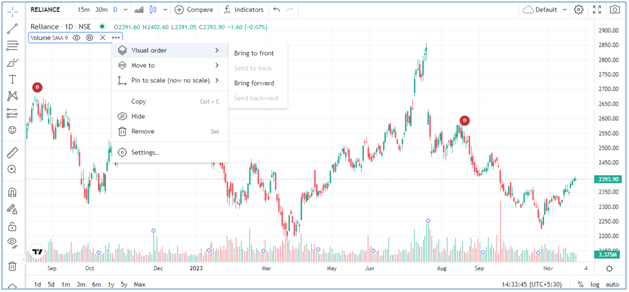
Furthermore, when you select the three dots at the volume status bar you can see the option to change the visual order to front or back and use this section to copy, hide and remove the volume option to open the settings to adjust the style and visibility.
How to Use Tradingview Chart?
Tradingview charts can be used to view the price data and movement of the selected symbol or stock with options to use various tools and indicators for performing the technical analysis. And to use the Tradingview chart you must have the technical knowledge of applying the most popular indicators and tools to identify the trend in the stock market.
Also Read: Is Technical Analysis Useful or Useless or Enough for Trading
To use the TradingView chart efficiently, there are various functions you have to use while analyzing the chart. From volume indicators to RSI, Moving Averages, Bollinger Bands and Fibonacci Retracement there are various other technical indicators you need to apply on different time intervals according to intraday trading strategy or for long term investment.
Also Read: Top 5 Best Technical Indicators for Intraday or Day Trading
However, knowing about a few basics of Tradingview chart you can use this charting system for fundamental and technical analysis to make the right decisions for trading. If you don’t have such skills, you can get help from the market experts to learn more about the Tradingview chart or you can keep visiting our website to read useful articles about the Tradingviewchart and technical analysis or fundamental analysis for trading in the market.
Also Read: Technical Analysis vs Fundamental Analysis: Which is Better
How to Adjust Tradingview Chart?
You can adjust the Tradingview chart as per your visibility criteria. Once the chart of any script loads, you can move your mouse cursor to squeeze or expand the chart area which increases and decreases the time period of a chart showing on your screen.
To see the previous and further period charts you can you can click and hold your mouse and drag the chart on the left-hand side or right side. However, you can also click on the plus and minus sign visible on the bottom of the chart to zoom in or zoom out of the chart area. For keyboard shortcuts, you can also use the Ctrl+upper navigation or lower navigation keys to zoom or unzoom the chart with the navigation icons to move the chart to either side.
How to Clear Tradingview Chart?
To clear or delete the Tradingview chart on your computer screen you have to simply go to the top right corner just before the icon settings. Here you have to click on the dropdown and click on “Load Chart Layout”, then a popup window in the name of “Load Layout” will open with the search box and current chart name showing just below the search box.

The chart name would be default if you have not given any name to your chart. Now you can select this chart and on the right side click on the cross button to clear the current chart. The confirmation popup box will open, just click on the yes button, the current chart will be deleted from the cloud storage and now you can open or load a new chart on TradingView.
How to Invert Chart in Tradingview?
In the TradingView chart, you can invert the price data showing on the Y-axis. For this, you have to apply the invert scale option and the price data on the right side will be showing from high to low or you can say in descending order. According to the price data inverted on the scale, the chart will also adjusted as per the movement of the stock for the period.

To invert the chart in TradingView, you just click on the icon like brightness control located at the bottom right side just below the data showing on the Y-axis. When you open this, there are multiple options to control or adjust the price data on the Y-axis. Here just click on “Invert Scale” and the data on the right side will be shown in descending order.
Here you can also click on “Move scale to left” then the Y-axis will be shifted on the left-hand side. However, there is another way to invert the chart on TradingView. You can right-click and under the scales section, you can again see the Invert Scale option. Just check-box the right click and the chart will be inverted with the price data on TradingView.
How to Save Chart Settings in TradingView?
To save the TradingView chart settings you have to simply click on the cloud icon located in the top right corner. Check the image below when you open this, there will be an option to save your chart settings. Just click on save and a popup window will open asking you to type the name of the chart settings you want to save. Once you have saved your chart settings you can reopen the same layout by choosing the Load Chart Layout option visible in the same section.

How to have or Set up Multiple Charts on TradingView?
Do you know you can set up or have multiple charts on TradingView? This feature is unique and useful when you want to compare the two stocks or indices on the same chart. However, this feature is available only with the paid version of TradingView software.

If you are using the premium version of the TradingView chart, you can have multiple charts on your computer screen. To enable the multi-chart mode of your layout on TradingView you can find the multiple chart format option located at the top bar just left left-hand side of the save chart option. You just need to click on the “Select Layout” button located on the main toolbar above your chart and choose the format to show multiple charts on the same chart panel.
How to Reset Tradingview Chart Settings?
To reset the Tradingview chart settings there are multiple options you can use. When you apply the reset chart option the entire chart will be refreshed and all the customization and other adjustments will rest and the original chart will be visible.
To reset the best TradingView chart settings right-click your mouse and you will see the first option is “Reset Chart”, just click on this and your chart will reload with the original settings. And if you have Customized the price scale on your chart you can also rest the same by clicking an icon on the bottom right side to reset the price scale data showing on the Y-axis.

When you reset the Tradingview chart only customization on the chart will be reset, and the indicators will be not affected. If you have written any text or applied any drawing or other indication manually on the chart area it will be also not affected when resetting the chart. To remove all these things you can use the delete icon shown on the left side of the chart. Similarly, for the indicators you have to manually click on the cross button to remove the same from the chart.
Wrapping-up
To use the TradingView chart effectively you have to set up the necessary chart settings, that we have told you in this article. You can set up, adjust, clear, reset and fully customize the tradingview chart layout settings as per your requirements. However, the free version has limited options and the paid version comes with more additional features to customize or set up the TradingView chart of any financial instrument trading on the stock exchange to make the best use of it.
However, there are multiple functions you might not be able to access while using the TradingView chart. For this, you should have a trading account and demat account with the broker that offers the best trading platform to trade or invest with the TradingView chart system integrated into the trading application or online trading platform for their customers.
Moneysukh offers the best trading platform in India with TradingView live chart and market data that is accessible through multiple devices. It is one the best discount brokers in India, providing the one-stop online trading and investing solution to invest or trade-in equity, commodity and forex markets. You can open a trading and demat account here and enjoy one of the best online trading facilities with Trade Radar and TradingView chart at the lowest pricing.
Also Read: Equity or Commodity which is better for Trading or more Profitable
Moneysukh also provides the facility to use the Algo-trading system with the best algo trading platform and trading strategies and the most popular & profitable algo trading strategies that you can choose as per the market conditions and trade through best algo trading platform offered here. When you trade with Moneysukh, you will also get free access to the TradingView premium version with more features and functions to perform market analysis.
Also Read: What is Algo Trading How it Works and is it Profitable
Using the advanced version of the TradingView chart you can perform the technical analysis and fundamental analysis to pick the best stock from the market for trading or investing. And here you will also get help from market experts who will keep giving you tips and recommendations to buy or sell the stocks, commodities and currencies on your mobile. So, what are you waiting for, just contact us and make the best use of the TradingView chart or investment apps and other resources meant for analysis and trading in the stock market and earn some extra money.
Also Read: Benefits of Investing in the Stock Market: Advantages of Share Market


1 Comment
Good day! This is my first comment here so Ijust wanted to give a quick shout out and
tel you I truly enjoy reading your posts. Appreciate it!