


Trading in the stock market is more or less a speculative action that traders do to make some profits. But positions in stocks are not created blindly even for short-term trading or intraday trading. There are some kinds of logic, reasons and possibilities evaluated by the traders before making any position in the stocks or any other underlying security.
For medium to long-term investment, fundamental analysis is used in the stock market. While for short-term trading or intraday trading, technical analysis is applied by traders across the financial markets. Traders perform technical analysis before buying or selling a stock. And without charts, performing the technical analysis is not possible in the stock market.
Also Read: 7 Biggest Mistakes To Avoid While Doing Intraday Trading
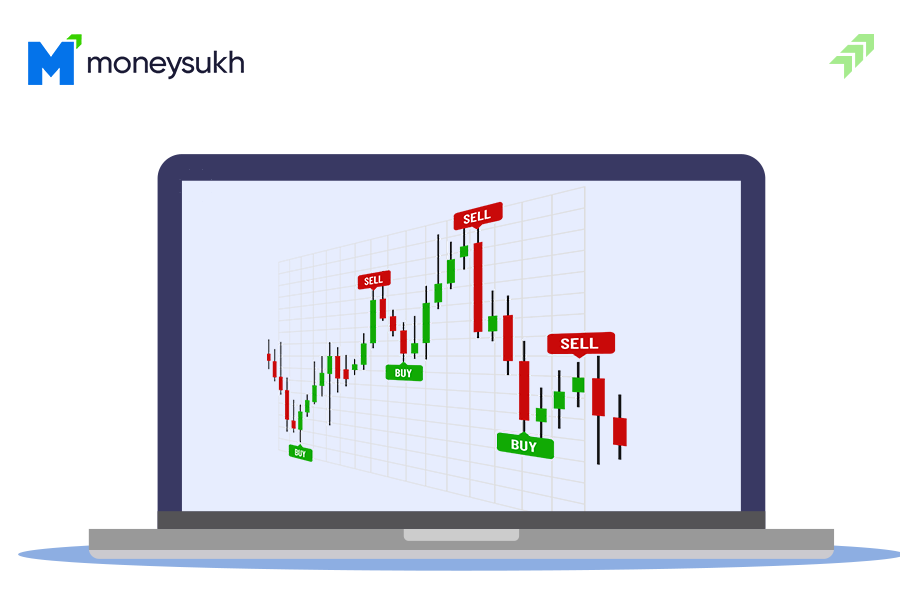
Apart from line charts, you have seen the candle-shaped charts that most traders used to analyse the stock movement. Various technical tools and techniques are applied to these charts to identify the buying and selling levels of the stocks. The green and red candle-like charts are called the candlestick charts. Today we will discuss the candlestick chart patterns, their types, how to read or analyse these charts and how to use them for trading.
What is Candlestick Pattern?
Candlestick charts are also known as Japanese Candlesticks, as it is originated in Japan over 100 years by a Japanese man named Homma, who discovered a link between the price and demand and supply of rice, where the market was mainly influenced by the emotions of the traders. And these emotions are visualised by showing the size of price moves with different colors. In this chart pattern, there are green and red two colours candles formed.
Candlestick Chart Simple Explanation
Each candlestick represents the four dimensions for a particular trading period, i.e. open, high, low and close. You can see there are only two colours of candles formed in the charts with the long tails on both sides, upper and lower that are called wicks. A green candle shows, the stock price ended or closed at higher than its previous day’s close price.
While a red candle shows, the close price for the day is lower than the previous day’s close price. And the long tails on the upper or lower side show how much stock moved high and low during that trading period. And finally, the thickness of the candle either green or red, shows where the stock price closed at the end of the day or trading period.
Types of Candlestick Patterns
The main motive for reading or analyzing such chart patterns is to find out whether a stock is heading towards the upside or going to fall down in the next moves. Overall mean to say, the chart pattern is giving a bullish or bearish signal in stock movement.
Also Read: Best Option Strategy for Bearish Market: 7 Option Strategies
Though, there are various types of candlestick chart patterns formed during trading hours, day trading or for the week or month. We brought here the most popular and most widely used candlestick chart patterns and we need to understand these patterns and guess the next move accordingly.
Top Most Powerful Candlestick Patterns:
- Hammer (Bullish)
- Bullish Engulfing (Bullish)
- Morning Star (Bullish)
- Piercing Line (Bullish)
- Hanging Man (Bearish)
- Bearish Engulfing (Bearish)
- Evening Star (Bearish)
Hammer (Bullish)
It is a single candlestick pattern shaped like a hammer, formed at the end of a downtrend and considered a bullish signal. The candle formed at the bottom of the downtrend with a short body and long lower wick, with almost no or little upper shadow.
This hammer-shaped candle formed when prices opened, and sellers initially pushed the prices down. But later when buyers jumped into the market and pull the price up resulting end of the day the stock price closed higher than the open price.
This formation of a bullish pattern signifies that the downtrend ended and buyers are back in the market. And for the confirmation of the bullish trend wait for the next day’s candlestick chart pattern, if a bullish candle is formed, you can create the long position.
Bullish Engulfing (Bullish)
This chart pattern can be identified when a large-bodied green candle is formed that is engulfing the full size of the preceding red candle. The entire body of this candle should engulf the previous candle and the larger the body the more extreme the reversal chances.
This kind of candlestick is formed when bulls have established some control and the price could move to the upside. In this Bullish Engulfing scenario, the buyers outpace the sellers, and when the next day, a bullish candle is formed, then traders get confirmed as a bullish signal and create the long positions.
Morning Star (Bullish)
When a morning star candlestick chart is formed, it is created between the two candles – one of them preceding a long red candle while the latter one a long green candle. The morning star candle between them is formed in the shape of a small candle stick with a short body with a bearish candle on the preceding side and a bullish candle the next day.
In the morning star candlestick usually, there is no overlap between the short and the long candles. This small size candle indicates the selling pressure is reducing and buyers are taking the position in the stock. And traders can use the next dual green candle for the confirmation of a bullish signal and can create a long position in the stock.
Also Read: What to Know Before Investing in Stocks: 10 Things to Consider
Piercing Line (Bullish)
The Piercing Line Candlestick chart pattern is formed when a long green candle is formed after the long red candle with a close price upper than halfway of the body of the previous red candle. This Piercing Line chart pattern also indicates the buying pressure.
The Piercing Line candlestick chart pattern shows the bulls are back in the market, and there should be a bullish reversal trend going to start. Again if the next day, a green candle is formed with a higher open and close price then this Piercing Line candle chart is considered the bullish signal traders use to make the buying position in the stock.
Hanging Man (Bearish)
Just like a man hanging on any wall, rope or road more likely chances of falling in the next move. Similarly, in this chart pattern, a short body is formed with a long lower wick created indicating a selling pressure on the stock is higher than buyers, thus bears are taking control of the market and stock is likely to fall if the next candles confirmed this pattern.
Hanging Man candlestick chart patterns is usually formed at the top of an uptrend in the market. This pattern is also known as the inverse hammer and is usually formed at the peak of the upward trend and signal trend reversal. The bearish signal can be confirmed when the next day’s candle closes under the hanging man, and traders can exit from the long position or short sell.
Also Read: What is Short Selling & How Does it Work: Is it Good or Bad
Bearish Engulfing (Bearish)
Bearish Engulfing is the inverse pattern of Bullish Engulfing in which a long red-shaped candle engulfs the previous day’s short green candle. Created usually at the top of the upward trend this pattern indicates the downtrend in the market is coming.
And this bearish engulfing pattern is more reliable when the next clean move is higher. However, before taking any action on such patterns, traders typically confirm the second candle’s formation. And when such a pattern is confirmed, traders exit from the long positions and enter into short positions. In a choppy or range-bound market, many engulfing patterns can be formed but they are unlikely to result in major price moves as the overall market is ranging.
Evening Star (Bearish)
An evening start candlestick pattern is formed when a candle with a short body is between a long green and a long red candle. The middle body of an evening star candle is very small, with short wicks on both sides upper and lower side and this chart pattern looks like a star twinkling in the sky. Evening Star is an indication of the reversal of an upward trend.
The entire body of the morning start candle does not overlap with the bodies of the candles formed on both sides. And if the third candle overcomes the gain of the first candle then this pattern is more confirmed. And when such patterns are confirmed, it is a reversal of an upward trend and sellers are now taking control and more selling pressure could develop.
Other Most Important Candlestick Patterns:
- Dark Cloud Cover (Bearish)
- Bullish Harami (Bullish)
- Three White Soldiers(Bullish)
- Bearish Harami (Bearish)
- Shooting Star (Bearish)
- Doji Candlestick (Bearish)
- Three Black Crows (Bearish)
How to Read a Candlestick Chart?
Reading the candlestick chart is very simple once, you understand the green and red candle shapes here. Basically, the green candle means stock in positive mode, while the red candle means stock in negative mode. But reading the candlestick chart would be not enough, you need to identify the chart patterns for several candlesticks and confirm the charts.
Once you understand the formation of candlesticks formed with different body shape you can read and analyses what these patterns indicate. Candles like Hammer, Bullish Engulfing, Morning Star, Piercing Lineand Bullish Harami are the candles showing the indication of a bullish trend or trend reversal of a downtrend means it’s time to create the long position.
Also Read: What is Long Unwinding in Stock Market: Is it Good or Bad?
While on the other hand, you can read candles like Hanging Man, Bearish Engulfing, Evening Star, Dark Cloud Cover, Bearish Harami and Shooting Star are candles give the indication of a trend reversal of upward movement and downtrend is going to start in the market. Here you can exit from a long position, book profit and can create short positions.
How to Identify Candlestick Patterns?
In technical analysis, candlestick chart patterns are playing an important role. But identifying the candle at the right time, at the right place with the right formation is important to interpret the market situation and enter into trade.
Identifying the single candle would be not enough to predict or analyze the situation you need to check the group of two-three candles formed before and after the indicating candle. And to identify the candlestick patterns first check what the chart pattern is, where this chart pattern is formed and how big is the chart pattern with volume the in the stock.
Also Read: Importance of Volume in Technical Analysis: Use & Role in Trading
Apart from identifying the candlesticks patterns accurately, you also need to make sure the pattern is formed as per the shape showing the true body of indicating chart pattern. Any kind of false or disguised formation of candle formation can give a wrong signal. Hence, along with the main candle showing the indicative chart pattern, always check the other candles formed around this candle like candles created before and after this to make sure of the pattern.
How to Confirm Candlestick Patterns?
After identifying the accurate formation of the candle, that shows a kind of indication of any of the above-listed type candles, you need to confirm the pattern. Without confirmation of the chart pattern, don’t decide to enter into any kind of trade position.
To confirm the candlestick chart pattern you need to check its shape and size, where it is located and what is the formation of other candles before and after this main candlestick. The location of the chart pattern is very important and what are the position and shape of other candles around it other key factors to confirm the formation of patterns.
Finally, the volume in the stock while forming the indicative candle plays a very important role in the confirmation of such chart patterns. Merely forming a candle is not enough to know the trend reversal, volume should be strong enough to confirm a reversal in the trend direction and a reversal in the direction of the price of the stock.
Another way to confirm the candlestick chart pattern is to use the support and resistance levels by drawing a trend line through a technical analysis tool. At the bottom of the bearish trend you can check the supports, while in the bullish trend, a resistance should be visible on the upper side to confirm the chart pattern and make the right decision accordingly.
How to Analyse Candlestick Chart?
After reading and confirming the candlestick chart, you need to analyse the whole situation around this candle, so that you can predict the next move and take your trading decision. I think you go to know how to identify a candle, the difference between green and red candles, relationship between open, low, high and close prices of the stock.
The body of the candle can be short or long, the shadow can be also long or short and a combination of all these displays shows the market sentiment towards that particular stock. When you see the candlestick chart, analyse whether the candle is forming any kind of pattern or not. If you see it resembles an indicative chart pattern, then check other charts.
Apart from before and after chart patterns, you also need to analyse the whole market situation, whether this pattern is formed at the peak or bottom of the market trend. In the current market trend of bullish or bearish, everything matters and analysing every related aspect is necessary to identify and analyse the pattern of the charts accurately.
While analyzing the candlesticks chart patterns, you also need to set the parameters like you looking at the chart patterns for long-term perspective or identifying the stock movement for intraday trading. Because according to that you have to select the candlesticks charts like hourly, daily, weekly or monthly to analyse the market situation precisely.
Also Read: 7 Biggest Mistakes To Avoid While Doing Intraday Trading
How to Use Candlestick Chart in Trading?
The main motive for reading and analyzing the candlestick chart patterns is to make the right decisions while entering into trading. Even the main use of charts is in trading to know where to buy or sell the stocks and earn profits from the trading activities. Hence, the question arises here, how to use a candlesticks chart for trading or investing?
Also Read: Trading or Investing Which is Better and More Profitable
Merely candlesticks are not enough to decide on trading you have to use several tools and techniques in combination with technical indicators like RSI, Moving Averages, Support & Resistance, Swings and other useful tools to find out the trend.
Steps to Use the Candlestick Chart in Trading:
Step 1: First of all of all identify the shape and size of the candlestick pattern.
Step 2: Now check the formation of before and after candlesticks of this pattern.
Step 3: Here you also have to check the current trend of the market to confirm this candlestick.
Step 4: Now check the level of volume to confirm if there is a trend reversal going to happen.
Step 5: Now apply the technical indicator like RSI or Movie Averages to confirm the pattern.
Step 6: And finally analyse the whole market sentiment before entering into the trade position.
Step 7: Now you can decide, whether to buy, sell or hold your stock according to the chart pattern.
Conclusion
Candlestick charts are no doubt one of the most powerful technical indicators traders used for trading. You can read the candles on an hourly, daily, weekly or monthly basis, in all the situations a green candle shows, the close price is higher than the previous close, while a red candle means the close price is lower than the previous day’s close with long wick showing highs and lows during that trade period.
Also Read: Technical Indicators that Every Trader should be aware of
You need to understand the formation of patterns and also check the candles formed before and after the main candle. While analyzing the chart patterns, also check the market or stock trend, whether it is running bullish or bearish, and then you can confirm what exactly the main candlestick chart pattern is showing, a trend reversal or trend will continue.
Finally, you can use various trading tools, techniques and technical indicators like moving averages, RSI or support & resistance with volume to confirm the trend. After applying these technical indicators you will get a clear picture what will be the next move of the stock. Now you can decide, whether to buy, sell or hold the stock for the trading.
In such situations, if you can’t recognize or analyse the candlestick charts precisely, you can take help from market experts. Moneysukh is providing trading and investment solution in the equity market, commodities and forex market with useful tips and recommendations to buy, sell and book profits in the trade positions helping traders to earn profits.
The market experts at Moneysukh are performing fundamental and technical analyses to analyse the stock for intraday, short-term trading and long-term investment. The technical analyst are using the candlesticks chart patterns and other technical indicators to analyse the stocks and market sentiments to recommend the stocks accordingly.
Also Read: Technical Analysis vs Fundamental Analysis: Which is Better
Moneysukh is also providing Algo-based trading services using advanced software applications to utilize the power of the automated trading system and help clients to earn money from the stock market. If you are also looking to trade, just apply to open a trading account and demat account with us and enjoy unlimited trading at the lowest pricing.
Also Read: What are the Most Popular & Profitable Algo Trading Strategies


No comment yet, add your voice below!