


You can use various indicators in TradingView to create the right trading strategy for intraday or positional-based long-term investment. There are various technical indicators but you can use the best indicators in TradingView that are most popular and effective in terms of giving the right signal. RSI is one of the best indicators in TradingView. Today we are going to discuss how to add, use, and rest RSI indicators with the right strategy in TradingView.
Also Read: What is TradingView & How to Use it for Trading
RSI Divergence Indicator TradingView
Relative Strength Index (RSI) is one of the best momentum-based oscillators used to measure the speed (velocity) as well as the change (magnitude) of directional price movements in the stock or market index. Along with giving the visual strength and weakness of the market, it also shows whether the stock price or market index is trading in an overbought or oversold zone.
Also Read: What is RSI in Trading & How RSI Works? Formula and Strategy
In TradingView, RSI is one of the most popular technical indicators used by traders for technical analysis. RSI oscillates between zero and 100 and when RSI Indicator is above 70,it is considered in the overbought zone and when RSI Indicator is trailing below 30 it means the stock is oversold. It is directly proportional to the price, which means when RSI increases the price also increases, while when RSI decreases, it indicates the price of a stock also decreases.
Also Read: Is Technical Analysis Useful or Useless or Enough for Trading
How to Add RSI Indicator in TradingView?
Just like other indicators adding RSI in the TradingView is easier. However, while adding theRSI or any other indicator TradingView might ask you to subscribe to the paid version. For limited use of TradingView and its functions, you can create an account with your registered email id and log in with the same details and follow the steps given below.
Steps to Add RSI Indicator in TradingView:
Step 1: First of all open the TradingView and search the symbol name or market index.

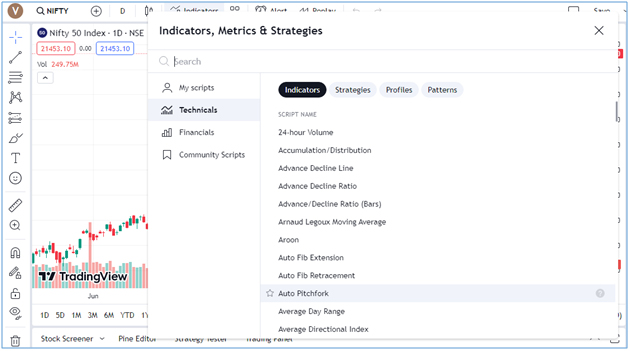
Step 2: Now navigate to the “Indicators Menu” to open the list of all the indicators.

Step 3: Now you can see the popup window in the name of “Indicators, Metrics & Strategies”.
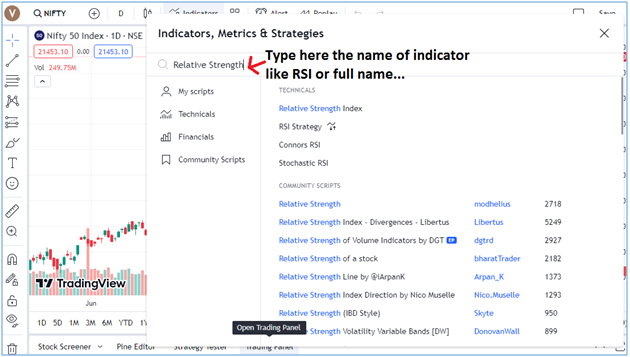
Step 4: Now type the full name of the indicator (RSI) you are looking for.
Step 5:You can see the list of indicators including RSI, and click to apply the indicator on the chart.
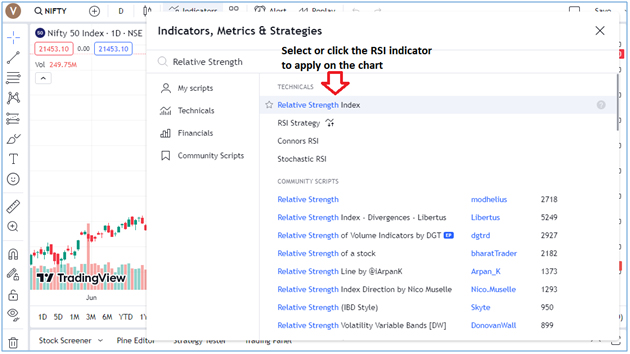
Step 6: Now you can see the RSI indicator is plotted just below the volume bars.

Also Read: Best Volume Indicators for Day Trading & How to Use for Intraday
How to Remove the RSI Indicator in TradingView?
Just like adding, removing the RSI indicator is also very easy with a few steps you can see below.
Step 1: Move your mouse cursor to the RSI indicator menu and highlight the (X) icon.

Step 2: Now just click on the cross icon and this RSI indicator will be removed.
Step 3: For another option to remove RSI, move your mouse to the three dots on the indicator menu.

Step 4: When you hover your mouse cursor on three dots you can see more options.

Step 5: Now you can see the list of more RSI menus, just click on the “Remove” option.
Step 6: When clicking on the remove button by directly clicking on the cross button or from the more options list, the RSI indicator will be removed from the TradingVew chart area.
Also Read: How to Add or Remove, Hide & Save Indicators in TradingView
How to Use or Read RSI on TradingView?
To read or use the RSI indicator on TradingView you need to understand its parameters that give certain signals at different levels. When you apply the RSI indicator it will be plotted by default it will be plotted with 14 days period. However, you can manually change the parameters in RSI from the variety of numbers of days as per your day trading strategy.
Also Read: How to Do Intraday Trading: Best Stocks, Charts & Strategies
RSI oscillates between the scale of 0 and 100, and when RSI moves below 30, it indicates the stock or market index is trading into the oversold zone, signalling the weaker the momentum is for price movements. On the other hand, when RSI is trailing above the 70 levels, it means the stock price or market index is trading into the overbought zone showing stronger momentum in the underlying index with an indication to book some profits.
Also Read: What is Profit Booking in Stock Market: Rules & Best Strategy
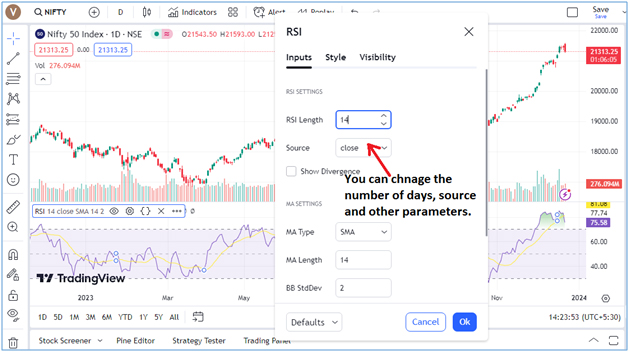
How to Change RSI Settings in TradingView?
The RSI indicator is by default plotted with 14 day period on the closing price of the stock or market index. However, you can change or modify the parameters or number of days in the RSI indicator. For RSI settings, follow the steps given below.
Step 1: Move your mouse cursor on the RSI indicator menu and hover on the settings icon.

Step 2: Now click on the setting icon to see the options to change the RSI settings.
Step 3: When you click on the settings icon a popup window opens showing Inputs, Style & Visibility.

Step 4: Now you can see the various options to change the settings in the RSI indicator.
Step 5: Apart from parameters, you can change the colours of the RSI line from the style section.

Step 6: You can also change the period ranges from seconds to months from the visibility section.
Best RSI Indicator Settings in TradingView
As we have already told you the default setting of the RSI indicator is 14 days closing price of the stock or the market index with a simple moving average of 14 days and Bollinger band standard deviation of 2 to show the best indication on the TradingView chart.
Also Read: How to Understand Chart Structure in TradingView: Explained
However, you can change the parameters and other settings in the RSI indicator as per your trading strategy and investment criteria. You can choose the longer period instead of the 14 days to see the long-term outlook of the price movement. You can also use the shorter period date to see the price movement of the stock or market index for recent days.
Also Read: Benefits of Investing in the Stock Market: Advantages of Share Market
For medium to swing trading, you can set and use the RSI settings at 14 days period, while for short-term or intraday trading you should choose the 9-11 days period to get a better indication. However, if you want to use the RSI to pick the stock for the long-term investment, you need to set the period at a higher range be around 20-30 days.
Also Read: How to Select Stocks for Intraday: 10 Tips to Pick Best Stocks
Best RSI Strategy in TradingView
Whatever the settings you choose while applying the RSI indicators the main motive should be to make your trading strategy successful and profitable. Hence, you need to apply the best RSI strategy TradingViewto know the trend more precisely.
The simple and by default RSI strategy in TradingView is to choose the length period for 14 days and set the overselling level at 30 and the overbought level at 70. Whereas an RSI between 30 and 70 is considered the neutral and an RSI trailing around 50 indicates that is no clear trend or stock is trading in the range bound trajectory with no significant movement.
Also Read: How to Identify Trend in Stock Market: 10 Points to Find Trend
When RSI swings between these levels you can take the decisions to create the long and short positions in the stock or market index. You can simply create the buy and sell strategy when the RSI is below 30 and above 70 levels respectively. However, you can use other top best technical indicators to confirm the trend and make the right decisions for trading.
Also Read: Top 5 Best Technical Indicators for Intraday or Day Trading
RSI Divergence in TradingView
The RSI also works as a divergence indicator in TradingView that you can use in your trading strategy. The RSI divergence happens when there is a difference between what the price action is indicating and what the RSI is indicating. You can interpret these differences as an upcoming reversal in the current trend in the stock price or market index.
Also Read: How to Find Trending Stocks for Intraday Trading: Ten Rules
In RSI divergence in TradingView, there are two types of divergences, bearish and bullish. A bullish RSI Divergence is considered when the price makes a new low but the RSI makes a higher low.Bearish RSI divergence happens when the price makes a new high but RSI makes a lower high. When you use these divergences, a bullish divergence creates a buying opportunity, while a bearish divergence creates a selling opportunity for the traders.
RSI for Uptrend or Downtrend in TradingView
You can use RSI to confirm the trends in the underlying assets. The RSI indicator tool cannot used for trend reversal but can be also used to confirm the uptrend or downtrend. As per the experts, a bullish divergence happens only in a bearish trend and a bearish divergence occurs only in a bullish trend.
Also Read: How to Use Moving Averages in Trading & Convergence Divergence
However, according to the TradingView experts both these divergences, typically cause a short-term correction and not an actual trend reversal.Hence, you can use the divergences as a trend confirmation, and not necessarily consider it for the trend reversal.
RSI for Trend Reversal in TradingView
Some of the market experts found the RSI as a useful indictor to know the positive and negative reversals. However, both Positive and Negative Reversals are considered as he opposite of the divergence. The positive reversal happens when the price touches a higher low while the RSI goes downat a lower low.Though the price continues to rise, positive reversals can occur when there is a bullish trend in the stock price and market index.
Conversely, a negative trend occurs, when prices move at a lower high, whereas RSI moves at a higher high, and price continues to fall. However, a negative reversal occurs only when there is a bearish trend running in the market index or stock price.
You can use the RSI for trend reversals but, positive and Negative reversals can be boiled down to conditions when the price outperforms momentum. Hence, the positive and negative reversals can be used as the trend confirmation, because the trend reversal can only occur in their specified trends.
Failure of Swings in RSI TradingView
As per other market experts, the failure swings are another occurrence that increases the possibility of price reversal that you can use through the RSI indicator. Before proceeding, keep one thing in mind the failure swings are that they are completely independent of price and rely exclusively on RSI.
The failure swings comprise four “steps” that are considered either bullish create a buying opportunity or a bearish trend that creates a selling opportunity.
Bullish Failure Swing: When the RSI fall below 30, considered oversold, and when the RSI bounce back above 30 or pulls back but remains above 30 and breaks out above its previous high, then it can be considered as the bullish failure swing.
Bearish Failure Swing: When RSI moves above 70 it is considered overbought and drops back below 70, and rises slightly but remains below 70 and further dropslower than its previous low, then it is considered as the bearish failure swing.
Also Read: Best Option Strategy for Bearish Market: 7 Option Strategies
Summing-up
The RSI indicator is one of the most useful tools in TradingView and can be used to interpret the trend of the market or stock. It helps to know the overbought and overselling positions of the stock price or market index, helping traders to create the trade positions accordingly. In TradingView you can add the RSI indicator by searching from the indicator menu.
Once you apply the RSI indicator in TradingView, you can change its settings or modify other parameters as per your trading strategy. However, the default setting for RSI is 14 14-day period with a 14-day moving average and a 2-day standard deviation.
Also Read: How to Set Up, Adjust, Save, Clear, Reset TradingView Chart Settings
The RSI settings can be changed as per the intraday, short-term trading or long-term investment strategy. As part of the RSI trading strategy, you can also use the RSI divergences to know the bullish and bearish RSI divergences and utilize these divergences for buying and selling decisions in the stock or the underlying market index or assets.
Also Read: 7 Biggest Mistakes To Avoid While Doing Intraday Trading
If you have full access to the paid version of TradingView, you can apply RSI and other technical indicators with permission to modify the settings as per your trading strategy. However, if you don’t have full access or a paid version of TradingView and looking to trade with TradingView chart, you can choose the best trading platform to use this software freely.
Moneysukh is one of the best discount brokers in India providing the one-stop trading and investing solution for all types of clients looking trading or investing in equities, commodities and currency. You can open a trading account and demat account with Moneysukh and will get the facility to trade online using the best application for trading.
Also Read: How to Open Demat Account: Benefits and Documents Required
Moneysukh provides online trading software like Trade Radar where clients will get all the information with an integrated TradingView chart setup to perform the fundamental analysis and technical analysis and trade from here directly. Trading with Moneysukh, you will also get online tips and recommendations to buy or sell the stocks in the cash market in the F&O (derivatives) segment or in the forex market directly on their mobile and email IDs.
Also Read: Options Trading: How it Works, Example & How to Trade
Apart from the research team performing the fundamental or technical analysis and providing the human-backed analysis, Moneysukhisalso providing the facility to take advantage of high frequency through the best Algo-trading platform with web based online access. Day traders can choose the best intraday algo trading strategy or trade with the most popular & profitable Algo trading strategiesas per their risk-bearing capability and investing time horizon prospects.
Also Read: Types of Risks Associated with Investing in the Stock Market


1 Comment
Thank you for your offering. 🙏