7 Candlestick Patterns You Can Use for Bullish Trend Reversal
Technical analysis is all about study of candlestick charts and patterns. Majority of traders using technical analysis to assess market conditions so that they can take profitable trades. With the help of candle stick charts, traders and market participants usually identify various bullish or bearish trends and take positions as per their beliefs. Moreover it’s a study of buying and selling behavior of traders in various timelines with the help of some advance technical indicators. Main objective is take profitable trades on the basis of past trading behavior.
What are Bullish Reversal Candlestick Patterns?
These specific candle sticks patterns represent terminations of bearish phase and starting of bulls. In simple words it indicates traders to close their short positions and create long in specific stock or index. Bullish reversal candle stick patterns plays a significant role where traders are bullish on market and do not want to carry short positions.
7 Types of Bullish Trend Reversal Candlestick Chart Patterns
Bullish trend reversal candlestick charts has many categories however these patterns doesn’t guarantee a sure shot profit or trend identification. Probability of success in these patterns always around 50-60% depending on other factors also. However these patterns still identified as first evidence of trend reversal. Here is the list-
-
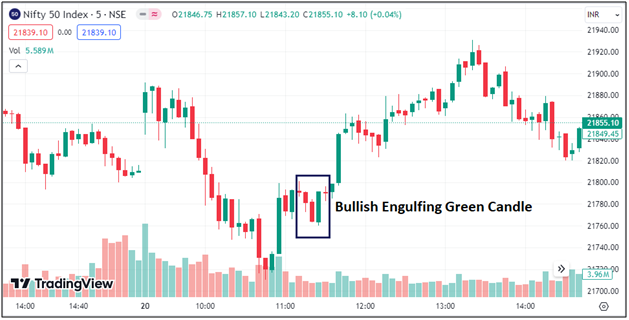
Bullish Engulfing Candlestick Pattern
This kind of trend reversal candlestick pattern requires 2 candles- one is bearish or red candle and size is small. Another one is green candle that should be bigger than red candle. Engulfing means green candle overlaps red candle completely and indicates bulls takes the front seat. In simple words first there is red candle in small size completely covered by big green candle. Moreover it is important to note that red candle can’t be in doji formation, it should be a proper candle formation as shown in the chart below with substantial volumes. In addition to this, this pattern would be confirmed if the next candles are formed green with higher closing.
-
Hammer Candlestick Pattern
Imagine hammer in your mind- an object with long handle and small upper body. Same in this reversal candlestick pattern, there is small upper body with long shadow formation followed by green candles. Colour of this candle stick pattern may be green or red but if there is green formation it could be more precise as trend reversal. It simply indicates at lower levels sellers closed their positions and buyers are the new driver of this car.
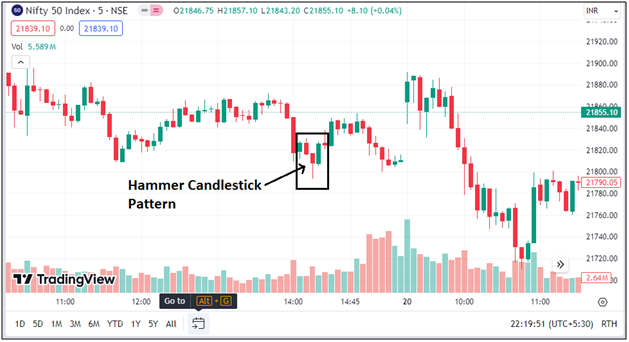
A hammer candlestick pattern shows that the bears tried to pull the price at new lows but bulls are back and pulled the price again. This signal would be stronger if a hammer forms after the decline in the price of the stock or market movement.
Inverted Hammer:
An Inverted hammer is another candlestick pattern use for identifying bullish trend reversal. This candlestick pattern is the opposite of the hammer. Formation of this pattern has long shadow or long tail on the upper side, with a small body and almost no shadow on the lower side. The upper price moment should be twice the size of the body of the candle. Here also, the colour of the candle is not important.
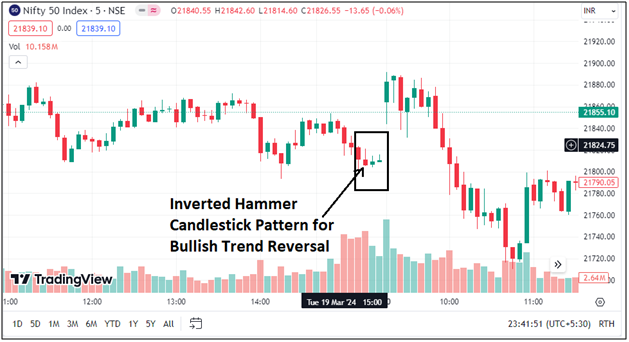
As can be seen from previous few candlesticks that buyers are trying to lift prices higher or trying to close the candle near or above the half way but as the trend came to end, bears are trying to push price lower before the bulls can finally takes over. Here again, the colour of the inverted hammer is not important but the confirmation of the further bullish candlestick pattern is awaited.
-
Bullish Harami Candlestick Pattern
This trend reversal candlestick pattern is bit complex and not for beginners. Actually this kind of pattern is little bit challenging for pro traders also as it requires some more confirmation from volume and other technical indicators
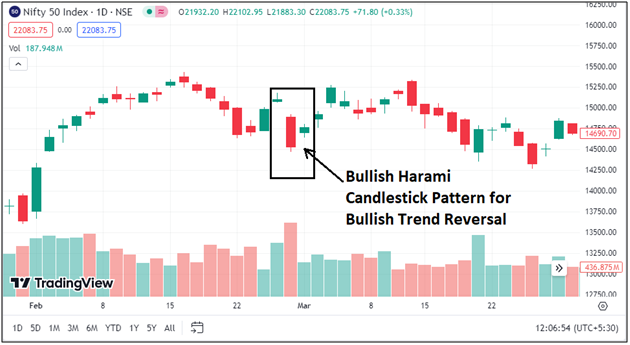
The identification of bullish harami pattern can be done with two candles. The first candle is red with a long body and the second candle is formed in the middle range with respect to previous long red candle. Strictly, the send candle formed should be contained within the body of the previous candle. The combination of the previous red candle and green candle represents a pregnant form giving the signal of the bullish trend reversal.
-
Morning Star Candlestick Pattern
A morning star candlestick pattern can be recognized with the combination of three candles. The first candle in this pattern is a bearish with a long body, showing the bearish trend to continue in the market. The second or middle candle is small in size and looks like a Doji with a small body and short wicks or shadows formed below the previous candle is called the morning star. The third candle should be a long green candle with a long body formed with the gap up and filling the gap of the previous bearish candle.
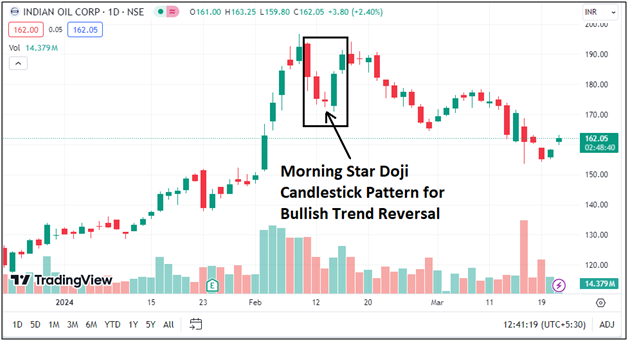
During the morning session, after the series of bearish candles in a security, when a morning Doji star is formed, it gives the signal of the end of the bearish trend with the indecision. But when the next or third candle is formed in green with the long body with a gap up opening gives a strong signal of bullish trend reversal. Further as the security formed bullish candles as a confirmation, a trader can create long positions in the underlying.
-
Piercing Line Candlestick Pattern
For getting signalling of reversal through piercing candlestick pattern two candlesticks are used. The first candle is a red candle and the second candle is green. Both candles should form long body shapes with small tails or without tails, as the shadows are not that important. Point to remember is that the open price of the green candle (latter candle) should be below the close price of the red candle (former candle). The closing point of the green candle (latter candle) should be above the midpoint of the body of the previous red candle, giving a signal of the trend reversal.
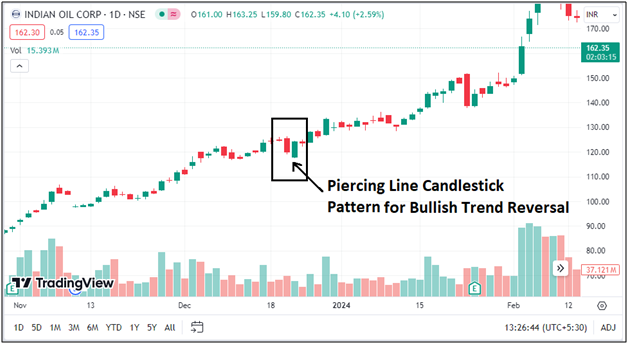
Formation of this pattern shows, initially the sellers were dominating the market and dragging the price lower but later buyers managed to overpower the seller and pushed the price higher, which led to trend reversal. With the formation of the next bullish candle or other technical indicators, you can get the confirmation of a bullish trend reversal giving the opportunity to enter into a long position.
-
Three White Soldiers Candlestick Pattern
Three white soldiers is another bullish trend reversal pattern. This type of candlestick patter is formed when bidders enter the market aggressively and putting considerable amount of pressure on buying side and therefore pushing the price higher. This type of candlestick pattern is easy to identify as the trader need to be watchful of three long bullish candlesticks with some assumptions.
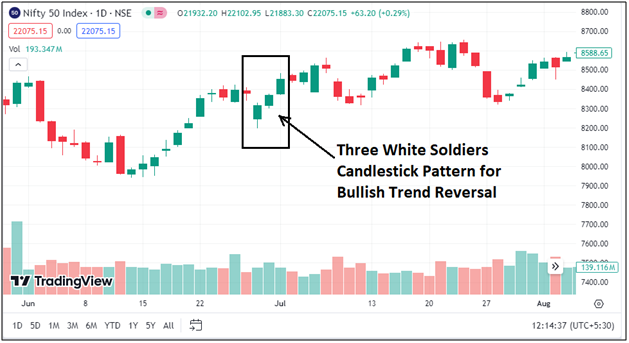
Points to consider; a trader should make sure that each candle in this formation should open within the body of the previous candle and it would be considered better if the candle opens above the middle of the body. The closing price of each candle should be near the session’s high. The shadows should be not big enough but the body of each three candles should be big giving a strong signal of a bullish trend reversal in the market. The trader can rely on this candlestick pattern but make sure the candles should close higher or gap up opening.
-
Bullish Abandoned Baby Candlestick Pattern
A bullish abandoned baby is another candlestick pattern you can use as a bullish trend reversal. It resembles the morning doji star containing the three candles. In Bullish Abandoned Baby the first candle should be red with a long body shape, and the second candle should be a doji formed below the low price of the previous candle. The last candle should be green with the gap up above the doji.
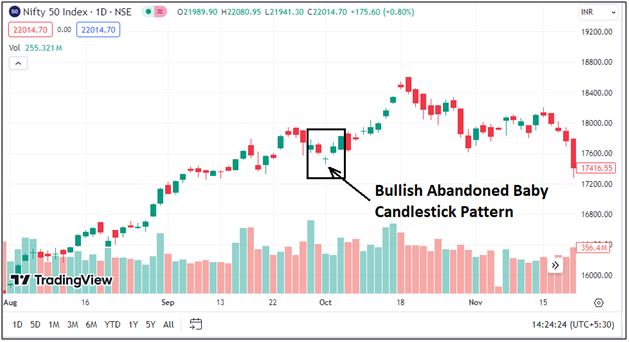
Bullish abandoned baby candlestick pattern is different from the morning doji star, in terms of the gaps on the booth sides of the doji. The gap between opening and closing forming the Doji shows the selling pressure in the stock price, but the selling pressure stabilizes and the price closes near to its open price.
But the formation of the next green candle with a gap-up opening indicates the increase in the buying pressure giving the bullish trend reversal signal. However, you can wait for the next bullish candle or use other indicators before creating any trade position in the market or buying the stock.
Summing-up
You can these bullish trend reversal candlestick patterns to create the trading strategy but for the confirmation of trend reversal or better prediction of the market movement you should use other technical indicators. However, if you can timely and precisely manage to recognize the candlestick patterns, it would be also helpful to predict the next move of the market or stock price.
However, to read, analyse and use the candlestick chart patterns for trading for the best accuracy you should use TradingView which offers the best software for market data and charting system to perform the fundamental analysis and technical analysis. Apart from most reliable getting the most reliable candlestick chart patterns for trend reversal, you can also easily apply the top best and most used indicators in TradingView to make the right decision before creating any trade position.
To choose the best trading platform in India for trading and investing you can open a trading account and a demat account with Moneysukh. Here, you can get the advantages of the best online trading platforms or apps with the best feature and demat accounts at the lowest brokerage. You choose from the various trading plans for different segments like equity, commodity and currency at best pricing.
Also Read: What are the Benefits of Demat Account: Advantages & Why you need it