


In the stock market checking the details of stock or indices technically as well as fundamentally is very important to perform the online share trading or investing strategy. When you check the price of a stock, you most probably also see the charts to know the trend of that particular script with the broader market indices and other underlying securities.
And if you have knowledge and experience in analyzing the stock technically and fundamentally you need all the indicators, tools and financial ratios to check and compare the price and valuation of stocks. Even traders or analysts also use the best trading platform and create profitable strategies while analyzing the stocks or any underlying index for trading.
Also Read: What to Know Before Investing in Stocks: 10 Things to Consider
The question arises here, how and where you can get all this data including the price charts, volume and other parameters and technical indicators that can be easily applied while analyzing the stocks to initiate the trade? And for long-term investment, you also need all the financial details like quarterly or annual results and key ratios of the company.
Here you need a complete or you can say all-in-one software solution or application that can provide you with all the stock market-related data on a real-time basis. Trading View is the one-stop solution for this, which can show you all such data that you can use for trading or investing. Let’s find out more about this software or tool, how it works, its features, how it is used and how it can be used for trading directly through the brokers operating in the financial markets.
Also Read: Trading or Investing Which is Better and More Profitable
What is Trading View?
TradingView is one the most advanced stock market applications or web-based platforms to show the various details required to trade or invest in financial markets like equity, commodity and currency. Apart from showing the real-time price data through a chart, it also provides the tools, indicators and financial details of the selected stock for analysis.
Also Read: Advantages and Disadvantages of Forex Trading: How to Start
Traders or investors using the TradingView application on their desktop or smartphone can draw charts, customize the price data and check the key ratios to create the right strategy for trading. Equipped with the most advanced features, and working on various cross-platforms, TradingView is very user-friendly and shows accurate and refreshed data.
Also Read: How to Be a Good Investor or Trader to Buy Best Stocks in 2023
Brokers across the world have integrated this most dynamic and reliable web application into their trading websites or platforms. It is also like a social networking platform for traders and investors to use this application to connect and share their knowledge and experience with each other to make their investment decisions more informed.
Also Read: Types of Risks Associated with Investing in the Stock Market
How Tradingview Works?
TradingView simply works on the algorithms to take the real-time data from the exchange and show it at the user end through the software. Apart from real-time data, this investment app also shows the historical price data of stock, commodity or currency with other key details like financial statements, technical indicators, parameters and key ratios like valuation ratios and financial ratios with news, corporate actions and other various other key information.
It can be installed or integrated on various web-based compatible platforms and works with computer systems connected to the internet. End-users can create their account on TradingView or use this through their broker website login details to use the various functions. Though, for direct use TradingView only limited features are available in the free version, in the PRO version it gives access to advanced and more useful functions for the traders and users.
It works best when you have high-speed internet to show you the real-time data of the market. Nowadays most traders and leading financial market-focused news websites are using TradingView on their online platform to provide readers a comprehensive details of securities, commodities and currencies making them well-informed and equipped.
How to Use Tradingview?
Using the TradingView is very easy and user-friendly, especially if have the knowledge and experience to draw the charts and apply the technical indicators. However, we brought here the stepwise procedure to use the Tradingview and its features.
Steps to Use the TradingView Web Application:
Step 1: First of all create your account with TradingView and login.
Step 2: Now after login, you will see the TradingView dashboard on your screen.
Step 3: To see the charts you can select the stock by searching name or symbol.

Step 4: Now you can choose the tools and draw the technical indicators on the chart.
Step 5: Using these tools and indicators you can analyse the stock movement.
Step 6: You can also check the financial details and key ratios of the stock.
Step 7: If you are connected with your broker you can place orders directly.
Step 8: You can also use the TradingView community to share your ideas and trading strategies.
Using TradingView directly through the website freely you will get the limited functions and features to use. For applying or using important technical indicators, creating alerts, saving the charts opening multiple tabs, customization or viewing the key financial details and valuation ratios you have to buy the paid version of TradingView.
Tools & Features of Tradingview
TradingView is equipped with advanced features and useful tools to find out the trend or stock or know the buying and selling positions. Traders very often use these tools to pick the stocks for trading or book the profits based on these key indicators. It has unlimited tools that are developed for technical and fundamental analysis, but below we have tried to highlight and discuss only the most popular and useful tools of the TradingView.
Advanced Charting System: The most important feature of technical analysis, yes TradingView is featured with one of the most advanced charting systems. Apart from the most popular charting patterns line chart and candlestick chart patterns, you can also use the bar cart or Heikin Ashi, Renko, or Kagi charts depending on your ease and understandability.
You can also customize the charts for different trading periods or draw the charts for multiple scripts or indices on the same or separate screen. You can also compare multiple stocks on the same screen by drawing the different charts by selecting the different types of patterns and colours making it easier for the users to analyse easily.
Tools to Draw on Chart: This dynamic platform offers most of the useful tools to draw the trend line on a chart or annotate the same to find the low and high points of the stock. Here you can apply drawing tools like trend lines, Fibonacci retracements, swings, and support & resistance on charts to perform the technical analysis.
Customized Trading Alert: Here you can create customised alerts for price levels, technical indicators, breakout & breakdown, corporate actions for specific events etc. You can enable the alert for visual popups, and audio signals or send it on your mail or smartphone through email-to-sms alerts, or email alerts and PUSH notifications shown quickly.

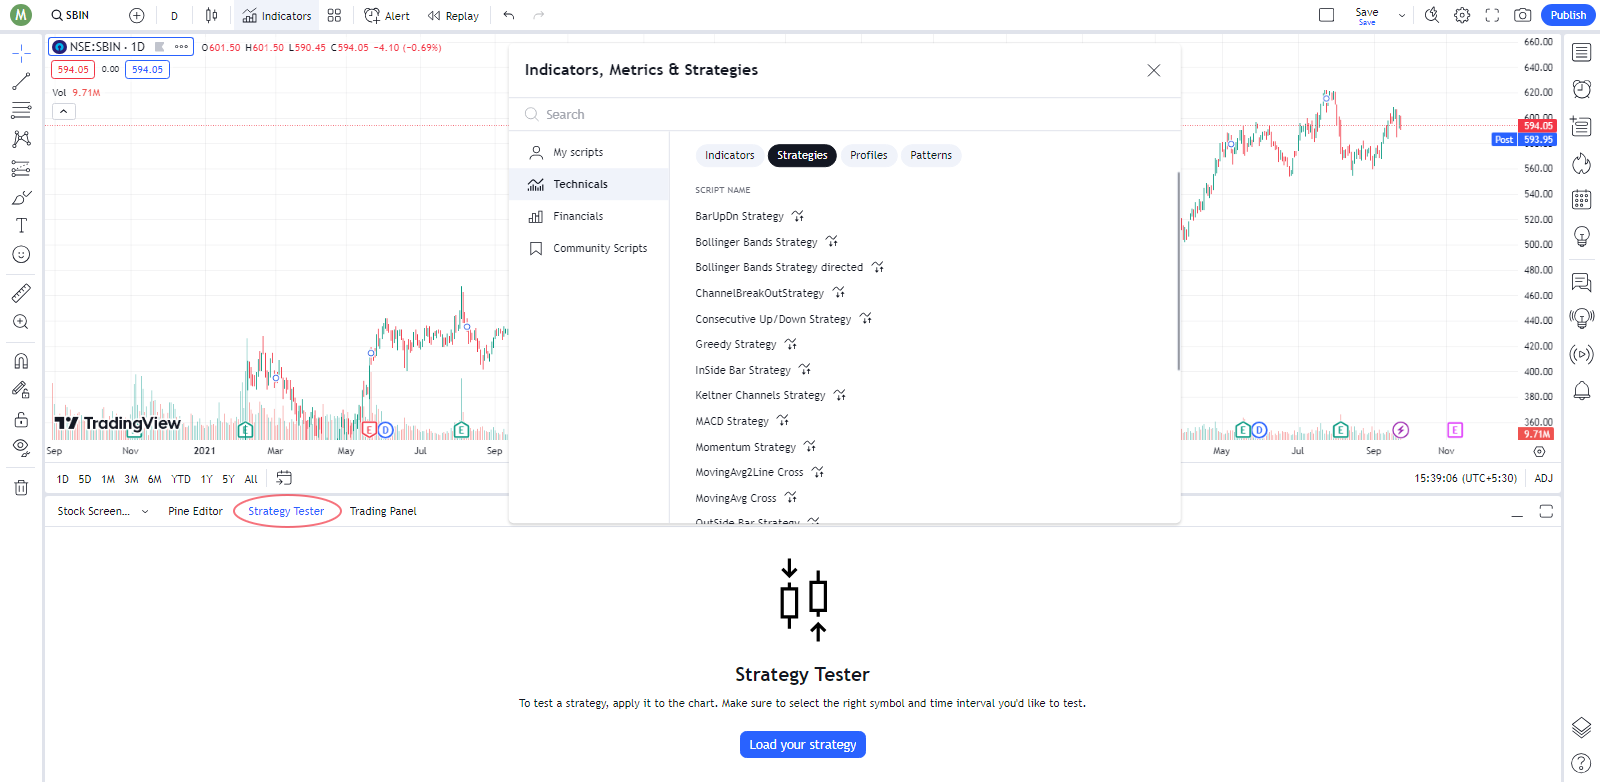
All the Technical Indicators: TradingView is one the best applications for trading where you can find and apply all the useful technical indicators developed for trading. Apart from short-term or long-term investment, you can use here the best technical indicators for intraday trading with the highest levels of accuracy of statistics in these technical indicators.
On TradingView you can select and use popular indicators like Moving Averages, Moving Average Convergence Divergence (MACD), Relative Strength Index (RSI),Bollinger Bands and many more as per your applicability and comprehensives. Here you can choose from more than 100 technical indicators with full customization of selecting the different parameters and make your technical analysis more accurate for making the right decision for intraday trading.
Also Read: How To Use Best Moving Averages for Intraday or Day Trading
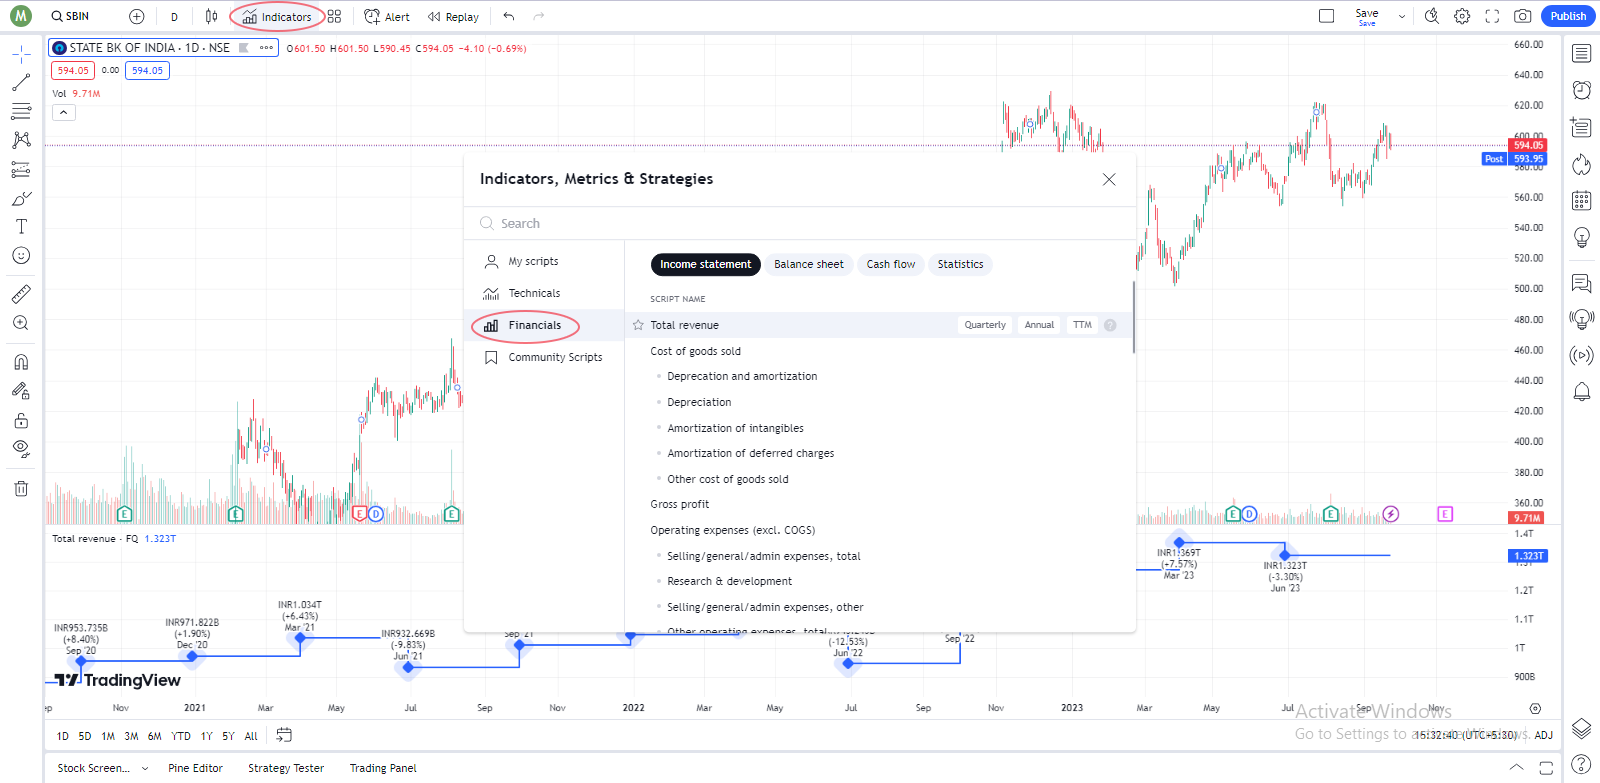
Financial Data &Key Ratios: TradingView could be one the best investment apps in the financial markets, as you can find here all the financial data of listed companies along with their key ratios are available here with updated data of financial statements. To perform the fundamental analysis you can find all the useful updated data here with valuation ratios.
Also Read: Difference Between Fundamental Analysis and Technical Analysis
Pine Scripts for Traders: It is one of the very few online trading software, where you can create your own customized features under this application. Yes, TradingView Pine Script TM programming language allows users to create their own alerts, strategies and indicators as per their feasibility and applicability to make the right trading or investing decisions.
Wide Market Data Coverage: It is considered one the best trading app in the world covering a wide range of market data available globally. TradingView web application and trading platform provides extensive market data of equity or stocks, commodities and forex market with the live feeds of all the major global market indices and individual stocks.
Also Read: Golden Rules of investing in Stock Market
How to Backtest on Tradingview?
Backtesting on the Tradingview is the process of manually or systematically (automatically) finding out whether a trading strategy or striding setup created on this online trading platform has been profitable in the past trading days or not.
Many traders before using Tradingview for real-time trading or investing, also backtest the strategy to find out if there are any chances to book profits and earn from the financial markets with profitability or if they are just wasting their time and money.
Also Read: What is Profit Booking in Stock Market: Rules & Best Strategy
You can try the manual backtesting even anyone can perform this. The results of backtesting can be slightly different if there is any alteration in data but it will also help you to know that there are certain parameters that work better than others. However, below you can find the stepwise guidance to run the backtesting of TradingView on your system.
Steps to Backtest the Strategy on TradingView:
Step 1: As you require the data for the backtesting, you can choose the long-term period timeframe like months and years for testing the long-term strategies. If you run the test for the short-term you can choose the small timeframes let’s say trading data for a week.
Step 2: Here you have to define the parameters, like setting the conditions for entering or exiting from the trade positions. Determine if the price of the stock will move you will take that action and repeat the same strategy. Also include the risk management in the parameters and allocate the same in each trade.
Step 3: Now use the TradingView rewind tool to turn back and remove the forecasting of chart patterns. You can also go back in time and check the trades from weeks, months or years in previous trades depending on how far you can check the trades.
Step 4: You need to analyse price charts to create the entry and exit points. You can do this till all the trading sessions on the chart up to the present time have been positioned and marked or you write them down on paper. However, it can take some time or a few sessions of backtesting and recording the results.
Step 5: When your testing process is completed you can calculate the total profits or loss you have earned or incurred using this trading strategy or setup in the backtesting trading sessions.
This backtesting will help you know how much your trading strategy is successful and works as per your expectations. However, sometimes backtesting does not work properly, mainly when data from live trading sessions is used. If you have not used enough historical data or tested with a small sample size then your result can be affected.
How to Paper Trade on Tradingview?
After backtesting the TradingView software with your trading strategy you can also try for the paper trading. This virtual trading process will help you to trade on real-time data test your trading strategy on the charts and see the outcomes. Paper trading on Tradingview is very simple, you just need to follow the steps given below.
Steps to Paper Trade on Tradingview:
Step 1: First of all browse and open the TradingView on your computer screen.
Step 2: Now using your login details sign your TradingView account.
Step 3: You can use your social account or create a new one if don’t have one.
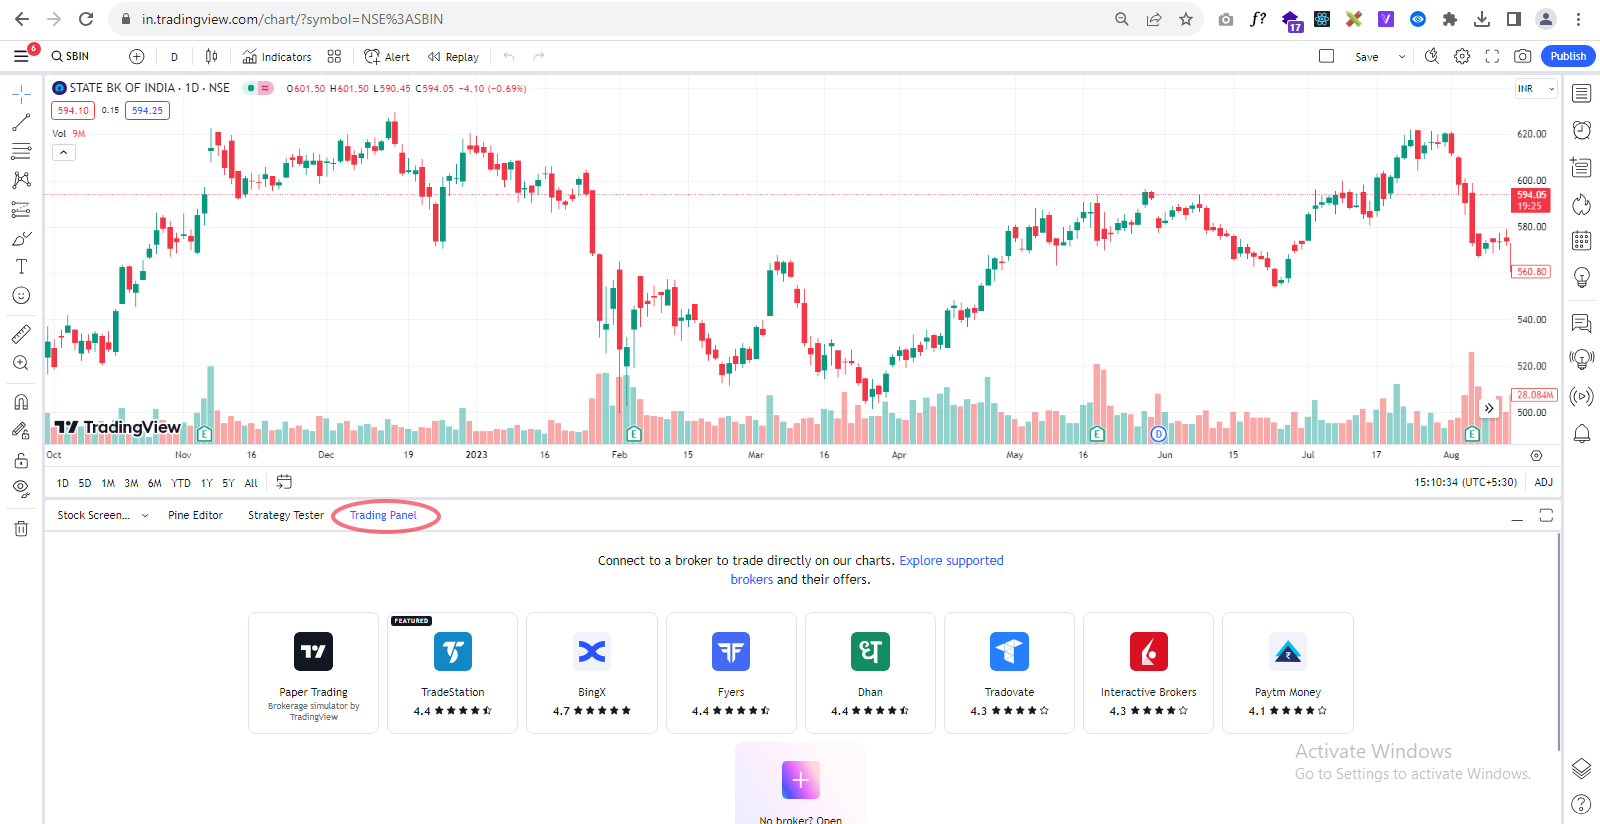
Step 4: Now navigate to the Trading Panel tab at the bottom of your screen.
Step 5: Here you need to select Paper Trading By TradingView before you start.

Step 6: Now choose any stock or indices and exchange to start the paper trading.
When you do the paper trading on TradingView software you can buy or sell the stocks on a real-time basis during the market hours. You can perform intraday trading, delivery-based trading or trade in F&O of derivatives market with virtual money.
Also Read: 7 Biggest Mistakes To Avoid While Doing Intraday Trading
It is one the best trading apps for beginners using paper trading users will not get to learn about various functions but can do the practice of drawing the technical indicators or using the tools and techniques integrated into this software. It will help the new users to become used to various functions and also gain the confidence of trading in the market.
How to Trade on Tradingview?
After backtesting and paper trading now you can start trading on TradingView to earn some money using this online stock trading platform on your desktop or smartphone. To trade on TradingView you need an account on this application and a trading and demat account with a broker to hold your and manage the details of your shares and transactions.
Steps to Trade on TradingView:
Step 1: First of all open TradingView and log in with your user ID and password.
Step 2: Now you have to connect your brokerage account with TradingView.
Step 3: Find out your broker from the selection and enable live trading.
Step 4: Now select the stock, commodity or currency you want to trade.
Step 5: Here you can apply the technical indicators and tools to create a trading strategy.
Step 6: Now you can place the order with selected stock, quantity, stop-loss and confirm the trade.
Step 7: After placing the order you can monitor your trade position or enable the alerts if the price of the stock reaches certain levels.
To make your trade successful on this platform you need to understand the Chart Structure Tradingview and analyse the various charts like candlestick chart patterns. If you are not aware of the chart patterns or don’t know how to read, analyze or use the candlestick chart pattern then you need to study about this, and if you are an expert go ahead.
Also Read: How to Read, Analyse& Use Candlestick Chart Patterns for Trading
How to Understand Chart Structure Tradingview?
To make your trading strategy more profitable you have to understand the chart structure of Tradingview. Because all the tools and technical indicators can be drawn on these charts and without the charts, you can’t visualize the stock trend or analyse the movement.
Steps to Understand& Analyze Chart On TradingView:
Step 1: Start with identifying the chart patterns, like bullish bearish, shoulders, double tops, or triangles that show the trend or trend reversal in the stocks.
Step 2: Now use or apply the technical indicators or momentum tools RSI, MACD, and Stochastic Oscillator to find out the momentum and trend in the stock.
Step 3: You also have to find out the support and resistance on the chart which are the points where stock resists or sustains and when these levels break breakout or break down you can enter or exit from the trade.
Step 4: Apart from price movement and chart patterns, you can also analyse the levels of trading volume in the stock or the underlying security. Volume plays an important role in trading, as the strength of high volume means there is the potential for a trend reversal or continuation of the current trend.
Also Read: Importance of Volume in Technical Analysis: Use & Role in Trading
What Brokers Work with Tradingview?
Most of the brokers globally are using TradingView to provide the best platform for chart and technical analysis. Apart from leading broking houses, most of the discount brokers in India are also using and integrating this application on their website to provide a one-stop trading solution to their clients with the facility to trade and view their holdings.
Apart from brokers, website users can also log in directly on TradingView and connect with their brokers who are using this software for trading. You just need to use the credentials and you can also trade on TradingView connected through your broker. This gives cross-functional access to both platforms for trading while using all the tools and technical indicators offered by TradingView for technical analysis or fundamental analysis.
Also Read: Technical Analysis vs Fundamental Analysis: Which is Better
Moneysukh is also one of the best discount brokers in India, using TradingView to provide the most advanced online platforms for technical analysis with the facility of intraday trading and buying stocks for medium to long-term investments. Here users just need to use the login details provided by the Moneysukh and they can use and trade.
Apart from the broker’s website or trading app, you can also use TradingView to trade by connecting with your broker and using the login details. However the brokers have to tie up or purchase the Trading View software system for trading can only connect through this platform and use all the functions including charting, drawing the tools and online trading.
How to Connect Broker to TradingView?
Connecting your broker to TradingView is very easy, you just need to use the login details of your broker to get access to your TradingView account. Below you can find the stepwise guidance to connect brokers to TradingView.
Steps to Connect Broker to TradingView:
Step 1: First of all open the TradingView on your device and go to the login panel.
Step 2: Now go to the Trading Panel and click the “Trade” button on the chart or on the toolbar.
Step 3: Here you have to under the Trading Panel, click on the “Broker” tab.
Step 4: Now from this section, you can select your broker from the list of supported brokers.
Note: In case your broker is not listed, you can still connect by using the TradingView Web Platform API. Just contact your broker to get the API keys required to connect your broker’s account with this.
Step 5: Once you have selected your broker, click on the “Connect” button.
Step 6: Here you will be asked to enter your broker login credentials.
Step 7: Just enter your username and password of your broker account.
Step 8: Now after entering the login details, you will be asked to get the permission of TradingView to access your account.
Step 9: Here you just have to Click the “Allow” or “Grant” button to give TradingView permission.
Step 10: And after allowing the permission, your broker account will be connected to TradingView.
Now you can trade directly from TradingView using your broker account. And if you prefer to use TradingView through your broker you can log in to your broker’s website where a trading facility is available and trade with this charting app.
Final Words
TradingView is no doubt one of the most comprehensive platforms for traders as well as investors to get all market data and useful information required to initiate the trade. Most brokers and financial markets-focused websites are now using this to show charts and other details making it easier for people to get all the useful data in one place.
It is equipped with a wide range of charting systems, technical indicators and various tools with financial data of the companies to analyse everything in a well-informed manner in dynamic financial markets and form the best strategy either for the short-term or intraday trading or for the long-term investments.
Also Read: How to Do Intraday Trading: Best Stocks, Charts & Strategies
It provides market data on a real-time basis with a fast refresh rate and extensive market data coverage of news, corporate actions and other information affecting the stock prices, commodities and currencies traded in the financial markets globally.
Moreover, TradingView is also facilitating a Pine Script programming language that allows the users to create customised indicators, and create alerts, from strategies making their trading experience more reliable and confident in terms of making decisions.
The social community and networking feature of TradingView is another unique and useful feature, that provides users an online platform to connect and share their ideas, knowledge and thoughts about the market with each other.
It is packed with various other features like video streaming, chat room and social interaction for discussing the market and exchanging their understanding and insights to improve their trading experience and enjoy a profitable journey.
And if you are a Moneysukh client you can also enjoy the power of TradingView through the online trading platform offered by the company. Moneysukh has integrated TradingView on its trading panel to provide a complete trading platform to its users, where they can see the charts apply the desired technical indicators and trade at one click.
How to Use or Trade with TradingView on Moneysukh?
If you have a trading and demat account with Moneysukh and you want to use TradingView through the online trading platform offered by Moneysukh, you just need to open https://trade.moneysukh.com/ on your browser and sign in with the login details. Here you can find TradingView is integrated with Moneysukh and you use all the functions apply the technical indicators on the chart and create a trading strategy or trade.
Steps to Trade on Moneysukh with TradingView:
Step 1: Open the trade.moneysukh.com in your browser and log in with your User ID & password.
Step 2: Now select the stock you want to see the chart and perform analysis for trade.
Step 3: Now you can customize the charts and apply the tools or indicators.
Step 4: You can also place orders directly from here, just click on trade.
Step 5: Define your quantity and limit price or select the market price.
Step 6: Here you also might be asked to select the exchange before placing the order.
Using the trade.moneysukh.com you can trade in equity, commodity and forex markets as per your KYC updated with the company. Trading with Moneysukh you will enjoy one of the best online trading experiences with the cheapest brokerage fees in the industry.
Apart from traditional human-intelligence-based trading services, Moneysukh also offers the best Algo trading platform and trading strategies with the best intraday algo trading strategy and the most popular & profitable algo trading strategies to provide the advantage of high-frequency trading to its clients looking to earn money with frequent trades.
Also Read: How to Start Algo Trading in Moneysukh: A Best Algo Trading Platform
If you have a trading account just start your trading journey from here and if you don’t have one, just apply to open a new trading account and demat account with your required documents. What are waiting for contact us now, or provide us your contact details, our representatives will contact you soon and help you to open all the desired accounts after verifying your IDs.


No comment yet, add your voice below!