Sagility India Limited – About the Company
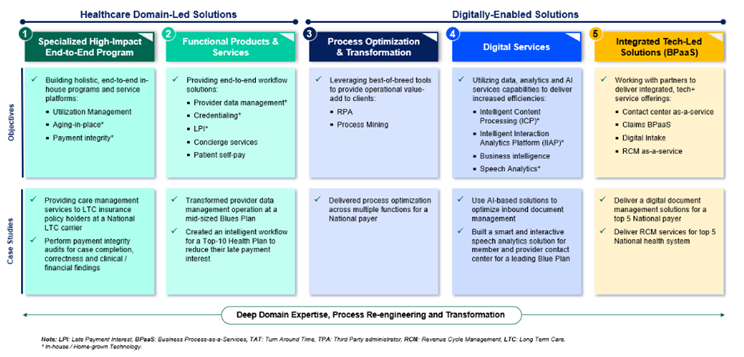
The company, incorporated in 2000, is a healthcare-focused solutions and services provider that supports payers and providers' core business operations. They offer services such as claims management, payment integrity, clinical management, and revenue cycle management. They processed 105 million claims and handled over 75 million member and provider interactions in 2024. The company also provides clinical management services, including chronic and complex case management, utilization management, and population health management. They also offer a 24-x7 nurse helpline for elderly care and assist payers in onboarding new providers.
Sagility India Limited IPO Objectives
The objects of the offer carry out the offer for sale of up to 984,460,377 Equity Shares by the Promoter Selling Shareholder. The company will not receive any proceeds from the Offer.
Sagility India Limited IPO Details:
| IPO Open Date | Not announced |
| IPO Close Date | Not announced |
| Basis of Allotment | Not announced |
| Listing Date | Not announced |
| Face Value | Not announced |
| Price | Not announced |
| Lot Size | Not announced |
| Total Issue Size | Up to 984,460,377 Equity Shares |
| Aggregating up to ₹[●] million | |
| Fresh Issue | Not announced |
| Not announced | |
| Offer For Sale | Up to 984,460,377 Equity Shares |
| Aggregating up to ₹ [●] million | |
| Issue Type | Book Built Issue IPO |
| Listing At | BSE & NSE |
| QIB Shares Offered | Not less than 75% of the Net Issue |
| Retail Shares Offered | Not more than 10% of the Net Issue |
| NII (HNI) Shares Offered | Not more than 15% of the Net Issue |
Sagility India Limited IPO Issue Price & Size
The Sagility India Limited IPO Issue Price will be in the range of Rs XXXX to Rs XXXX. Anyone looking to invest in Sagility India Limited through IPO can bid within these price ranges. The Sagility India Limited IPO issue Size would be around Rs 2500 crore and will be purely an offer for sale by existing shareholders.
Sagility India Limited IPO Launch Date
The IPO of this company is launching on (XXXX), hence the opening date for bidding is (Open Date) and the IPO is closing on (Closing Date). Investors can bid in this IPO between these days during the primary market hours.
Sagility India Limited Financial Statements:
| Particulars | FY24 | FY23 | FY22 |
| Revenue from operations | 47535.57 | 42184.08 | 9234.07 |
| Other income | 279.47 | 176.52 | 209.87 |
| Total income | 47815.04 | 42360.6 | 9443.94 |
| Expenses | |||
| Employee benefits expense | 29376.44 | 24942.01 | 5057.13 |
| Other expenses | 7276.23 | 6969.95 | 2281.09 |
| Total expenses | 36654.67 | 31911.96 | 7338.22 |
| Earnings before interest expense, taxes,
depreciation and amortisation |
11160.37 | 10448.64 | 2105.72 |
| Finance costs | 1851.45 | 2148.49 | 652.16 |
| Depreciation and amortisation expenses | 6892.11 | 6443.38 | 1472.1 |
| Profit/ (Loss) for the year / period | 2404.69 | 3764.41 | 354.92 |
| Basis EPS | 0.53 | 0.33 | -0.05 |
| Diluted EPS | 0.53 | 0.33 | -0.05 |
| Particulars of financial KPI | FY24 | FY23 | For period beginning July
2021 to March 2022 |
| Revenue from Operations (₹ million) | 47535.57 | 42184.08 | 9234.07 |
| Revenue by Vertical split: | |||
| By Payer | 42904.18 | 38254.26 | 8447.42 |
| By Provider | 4631.39 | 3929.82 | 786.65 |
| Growth in revenue from operations % | 12.69% | Not
meaningful |
N/A |
| Restated profit/(loss) before tax | 2416.81 | 1856.77 | -18.54 |
| Restated profit/(loss) before tax margin (%) | 5.08% | 4.40% | -0.20% |
| Restated profit/(loss) for the year / period | 2282.66 | 1435.72 | -46.71 |
| Restated profit/(loss) margin (%) | 4.80% | 3.40% | -0.51% |
| EBITDA (₹ million) | 11160.37 | 10448.64 | 2105.72 |
| EBITDA margin (%) | 23.48% | 24.77% | 22.80% |
| Adjusted EBITDA (₹ million) | 11.714 | 10448.64 | 2105.72 |
| Adjusted EBITDA margin (% | 24.64% | 24.77% | 22.80% |
| Adjusted PAT (₹ million) | 5895.58 | 4555.93 | 661.75 |
| Adjusted PAT margin (%) | 12.40% | 10.80% | 7.17% |
Promoters & Shareholding: Sagility India Limited IPO
There are two promoters of the company and promoters hold 100% of the paid up capital of the company.
- Sagility B.V.
- Sagility Holdings B.V.
| Name of the Selling Shareholder | Number of Equity Shares proposed to be offered for sale |
| Sagility B.V. | Up to 984,460,377 |
Why Invest in Sagility India Limited IPO?
Leader in U.S. Payer and Provider solutions market
The U.S. healthcare market is expected to grow due to factors such as an aging population and chronic diseases. The market is expected to grow at a CAGR of 8.7%, with the payer outsourcing market forecasting a 7.0% CAGR from 2023 to 2028. The provider operations outsourcing market is expected to grow at a CAGR of 12.5%. The growth in the U.S. healthcare services market, outsourcing trends driven by technological developments, and the non-discretionary nature of services drive growth in the business.
Domain expertise in healthcare operations
With the team of 1,687 healthcare professionals, the company offers services to Payer and Provider clients, focusing on end-to-end front and back-office healthcare services. Their expertise in the U.S. healthcare industry allows them to navigate complex services, compliance requirements, and payment workflows. They have extensive experience in nursing, medical coding, physical therapy, dentistry, pharmacy, occupational therapy, microbiology, or laboratory science.

Proprietary tools and platforms
The company has developed a suite of proprietary tools and platforms to support its Payer clients' operations and healthcare Provider clients' revenue cycle management functions. These tools include cloud-hosted platforms for clinical and non-clinical employees, RCM workflow tools, intelligent intake and content processing, analytics, speech processing and interaction analytics, automation, and Gen AI.
The company uses reusable and reconfigurable components to build new tools based on clients' unique requirements and integrates with third-party platforms.
Deep client relationships
As of FY24, five largest client groups had an average tenure of 17 years with the business. Companies clients are payers and providers based in the U.S. The company serves five of the top 10 payers by enrollment in January 2024. They also serve one of the largest U.S.-based hospital networks, three of the top 6 PBMs by claims volume, and other large diagnostic laboratories, hospitals, DMEs, and radiology companies. They have expanded our business to newer clients, adding 13 and 7 new clients in the FY 2024 and 2023.
| Metric | FY24 | FY23 | FY22 |
| Total number of client groups* | 44 | 35 | 31 |
| Number of New Client Additions | 13 | 7 | N/A |
| Number of clients contributing to more than
US$20 million in revenues |
5 | 4 | 3 |
| Number of clients contributing to US$5 million
– US$20 million in revenues |
7 | 7 | Nil |
| Number of clients contributing to US$1 million
– US$5 million in revenues |
12 | 12 | 10 |
| Less than US$1 million in revenues | 20 | 12 | 18 |
Risk factors
Business concentration
The demand for company services and all of its revenues comes from U.S. healthcare industry. Economic factors, disposable income and industry trends impact its business, such as reduced government healthcare spending, people budgetary pressure, and reduced demand for non-urgent services. Changes in regulations, such as annual Medicaid eligibility reviews, can also impact its business. Moreover outsourcing services or in-house talent and cost reduction, can lead to clients changing their engagements.
Employee expenses
Employee’s benefits which include salaries, bonuses, allowances, etc makes up major pie of the expenses. These expenses may increase due to factors such as inflation, minimum wage increases, social security measures, competition for talent and most importantly demand for skilled workforce. If the cost keeps on increasing and the company is not able to pass on to clients then it may affect their financials directly.
| Particulars | FY24 | FY23 | From July 28, 2021
– March 31, 202 |
|||
| Amount | As a % of Rev from Ops | Amount | As a % of Rev from Ops | Amount | As a % of Rev from Ops | |
| Employee benefits expenses | 29376.44 | 61.80% | 24942.01 | 59.13% | 5057.13 | 54.77% |
Revenue concentration
As can be seen from the below, company derives healthy portion of its revenue from top 3 clients and approx 80% of the revenue from top 5 clients. Although the share of these groups has declined over the years but remains concentrated. Any downsizing by key clients' could affect their business directly, deteriorating financial conditions.
| Particulars | FY24 | FY23 | For the period July 28, 2021 – March 31, 202 | |||
| Amount | % of Rev from Ops | Amount | % of Rev from Ops | Amount | % of Rev from Ops | |
| Revenues from 3
largest client groups |
32476.84 | 68.32% | 30536.72 | 72.39% | 7031.58 | 76.15% |
| Revenues from 5
largest client groups |
37627.68 | 79.16% | 33981.79 | 80.56% | 7660.48 | 82.96% |
| Revenues from 10 largest client groups | 43451.78 | 91.41% | 38251.61 | 90.68% | 8490.73 | 91.95% |
Anti-outsourcing legislation
Some states in USA have passed legislation restricting state government entities from outsourcing certain work to service providers. If the law is enacted, these measures could broaden restrictions on outsourcing, potentially impacting customer service and business results.
Sagility India Limited Grey Market premium
The Sagility India Limited IPO GMP is not yet known as the IPO price is not disclosed. Once the IPO is open, the price will be disclosed and as per the demand and supply of the share price in the open market, the Sagility India Limited IPO GMP will be known. If the IPO price is undervalued, less GMP and as per the valuation of the stock overvalued there is less chance for higher GMP.
How to Apply for Sagility India Limited IPO?
If you have a share trading and demat account at Moneysukh, you can easily apply for the Sagility India Limited IPO. Just follow the steps given below.
Step 1: Once Sagility India Limited IPO opens you can apply online.
Step 2: Browse at trade.moneysukh.com and log in with your Moneysukh User ID & password.
Step 3: Now you have to visit the IPO section and select Sagility India Limited IPO.
Step 4: Here just fill in the required such as bidding price, quantity or lot and so on.
Step 5: Now you have to make the payment and your IPO application is successful.
How to Check Sagility India Limited IPO Allotment Status?
Just like applying, checking the Sagility India Limited IPO Allotment Status is also very easy and hassle-free through Moneysukh online platform. You have to just wait till the IPO is closed and the allotment is finalized. If you have been allotted any share it will be transferred into your demat account that you can sell after listing of the shares on the NSE or BSE stock exchanges.
Also Read: How to Increase the Chances of IPO Allotment
However, if IPO is oversubscribed and unfortunately if you have not been allotted any share, your IPO application money will be returned to your bank account or linked account where you have allocated the fund while applying for the Sagility India Limited IPO.
Also Read: How to check IPO allotment status on NSE, BSE through Moneysukh


