Unsecured loans, which ICICI Bank leads the industry in, have grown by more than 35% for six consecutive quarters, and the bank has maintained its exceptional asset quality while doing so. We are convinced that the bank will be able to create productivity and efficiency benefits, allowing it to deliver and sustain RoA’s in excess of 2% in conjunction with incremental investments around digital and physical channels.
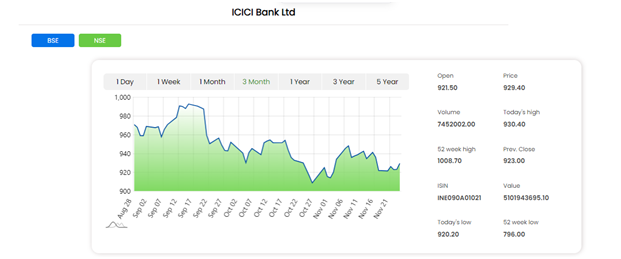
The unsecured book (13.6% of loans) saw the highest year-over-year expansion of more than 37.7%; however, as anticipated, a dramatic decrease in NIMs on the back of a high surge in funding costs caused NII to remain level sequentially despite good growth numbers. Yields were relatively stable on a sequential basis (-5.6 bps QoQ) due to repo-linked (48%) and MCLR (18%) portfolios.
Credit costs were reduced thanks to fewer slippages in the retail book and greater recoveries in the business portfolio, which contributed to exceptional asset quality overall. NIM compression is likely to persist, however, due to the high level of competition for low-cost deposits and the fact that most asset repricing has already occurred. With continued loan growth of more than 17.8% YoY and reduced credit costs of around 24 basis points, ICICI Bank recorded another successful quarter, preserving its strong asset quality and healthy deposit growth (around 20% YoY), led by retail term deposits and rocketing loan growth. However, CASA repoted slightly lower figures as compared to the previous quarter (-220 pts). As a result, we advised clients to accumulate ICICI Bank with the Rs 1255 price target.
What is net interest margin?
Net interest margin (NIM) is a key financial metric used by banks and other financial institutions to measure the profitability of their lending activities. It represents the difference between the interest income generated from loans and investments and the interest expenses incurred on deposits and borrowings. NIM is expressed as a percentage and provides insights into how effectively a bank is able to generate profits from its interest-earning assets while managing its interest-bearing liabilities. A higher NIM indicates better profitability, as it suggests that the bank
Importance of NIM
Banks can generate more income from their loans and investments compared to the interest expenses they incur. This is crucial for banks, as it directly impacts their ability to generate sustainable profits and maintain financial stability. Additionally, NIM is an important metric for investors and analysts as it helps them assess the overall financial health and performance of a bank.
Understanding the Net Interest Margin
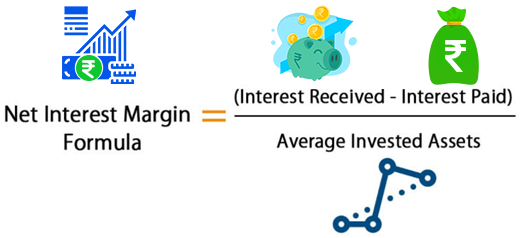
Net interest margin (NIM) is a key financial metric used to measure the profitability of a bank’s core lending activities. It represents the difference between the interest income generated from loans and investments and the interest expenses paid on deposits and borrowings. NIM is calculated by dividing the net interest income by the average earning assets of the bank. This metric provides insights into a bank’s ability to effectively manage its interest rate risk and generate profits from its lending operations.
Comparison of NIM with other key financial ratios
NIM provides a more comprehensive understanding of a bank’s overall profitability and risk management. For instance, comparing NIM with the return on assets (ROA) ratio can indicate how effectively the bank is utilizing its assets to generate income. Additionally, comparing NIM with the return on equity (ROE) ratio can highlight the bank’s ability to generate profits for its shareholders relative to its capital base. These comparisons can help stakeholders assess the bank’s financial health and performance in a more holistic manner.
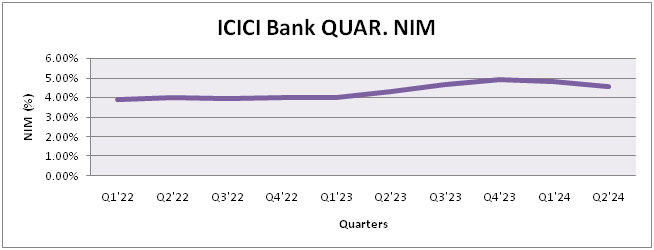
ICICI Bank’s Net Interest Margin Performance
ICICI Bank’s net interest margin (NIM) has shown a consistent trend of improvement. This indicates that the bank has been able to effectively manage its interest income and expenses, resulting in higher profitability. The NIM performance reflects ICICI Bank’s ability to generate interest income from its lending activities and efficiently manage its funding costs. This positive trend in NIM is a positive indicator of the bank’s overall financial performance and its ability to generate sustainable profits.
ICICI Bank Financial Data
Profit and Loss statement
| Particulars (in cr.) | Mar-23 | Mar-22 | Mar-21 | Mar-20 | Mar-19 |
| Interest Earned | 121066.81 | 95406.87 | 89162.66 | 84835.77 | 71981.65 |
| Interest / Discount on Advances / Bills | 87929.24 | 66886.54 | 60261.69 | 60928.31 | 50884.83 |
| Interest on Investments | 27905.03 | 21990.64 | 23264.25 | 20971.2 | 18102.29 |
| Interest on balance with RBI / Other Inter Bank Funds | 2305.46 | 1819.6 | 1881.72 | 907.41 | 927.11 |
| Interest on Others | 2927.09 | 4710.09 | 3755 | 2028.85 | 2067.43 |
| Other Income | 65111.99 | 62129.45 | 72029.53 | 64950.33 | 59324.85 |
| Total Revenue | 186178.8 | 157536.32 | 161192.19 | 149786.1 | 131306.5 |
| Interest Expended | 50543.39 | 41166.67 | 42659.09 | 44665.52 | 39177.54 |
| Interest on Deposits | 39476.54 | 33613.28 | 33719.66 | 33224.28 | 26995.18 |
| Interest on RBI / Inter-Bank Borrowings | 1338.1 | 440.2 | 1200.11 | 2166.49 | 2471.77 |
| Other Interest Expenses | 9728.75 | 7113.19 | 7739.32 | 9274.75 | 9710.59 |
| Employee Benefits | 15234.17 | 12341.6 | 11050.91 | 11156.75 | 9425.26 |
| Provisions and Contingencies | 6939.92 | 8976.65 | 16377.39 | 15014.07 | 20461.82 |
| Total Other Expenses | 65690.3 | 59480.12 | 63880.69 | 59189.94 | 53887.78 |
| Operating Expenses | 41655.12 | 39876.28 | 47051.32 | 42558.65 | 39168.64 |
| Administrative and Selling Expenses | 14303.27 | 11449.31 | 10487.82 | 10130.23 | 9166.99 |
| Other Expenses | 9731.91 | 8154.53 | 6341.54 | 6501.05 | 5552.15 |
| Depreciation and Amortization | 1514.56 | 1330.01 | 1340.07 | 1171.22 | 945.84 |
| Total Expenses | 139922.33 | 123295.04 | 135308.14 | 131197.5 | 123898.2 |
| Profit Before Tax | 46256.47 | 34241.27 | 25884.05 | 18588.61 | 7408.26 |
| Taxation | 11793.44 | 8457.44 | 5664.37 | 7363.14 | 1719.1 |
| Current Tax | 11456.44 | 7404.45 | 6261.18 | 5177.81 | 4808.28 |
| Deferred Tax | 337 | 1052.99 | -596.81 | 2185.33 | -3089.18 |
| Profit After Tax | 34463.03 | 25783.83 | 20219.68 | 11225.47 | 5689.16 |
| Minority Interest After Net Profit | -1424.67 | -1428.16 | -1979.65 | -1659.16 | -1434.92 |
Dividend History
| Announcement Date | Ex Dividend Date | Dividend Amount | Dividend(%) | Dividend Type |
| 22-Apr-23 | 09-Aug-23 | 8 | 400 | Final |
| 23-Apr-22 | 08-Aug-22 | 5 | 250 | Final |
| 24-Apr-21 | 29-Jul-21 | 2 | 100 | Final |
| 06-May-19 | 22-Jul-19 | 1 | 50 | Final |
| 07-May-18 | 24-Aug-18 | 1.5 | 75 | Final |
| 03-May-17 | 20-Jun-17 | 2.5 | 125 | Final |
| 29-Apr-16 | 16-Jun-16 | 5 | 250 | Final |
| 27-Apr-15 | 04-Jun-15 | 5 | 250 | Final |
Also Read -: Five Corporate Actions and Its Impact on Stock Prices
Key Ratios
| Key Ratios | Q1’22 | Q2’22 | Q3’22 | Q4’22 | Q1’23 | Q2’23 | Q3’23 | Q4’23 | Q1’24 | Q2’24 |
| Cost of deposits | 3.65 | 3.53 | 3.47 | 3.48 | 3.46 | 3.55 | 3.65 | 3.98 | 4.31 | 4.53 |
| Cost-to-income | 40.4 | 39.9 | 41.1 | 40.6 | 42.3 | 41.1 | 38.2 | 39.2 | 40.2 | 40.9 |
| Core operating profit/average assets | 2.88 | 3.09 | 3.09 | 3.06 | 2.95 | 3.2 | 3.5 | 3.6 | 3.44 | 3.36 |
| Provisions/core operating profit | 33.1 | 28.5 | 20 | 10.5 | 11.1 | 14 | 17.1 | 11.7 | 9.3 | 4.1 |
| Provisions/average advances | 1.57 | 1.44 | 1.01 | 0.53 | 0.53 | 0.71 | 0.93 | 0.65 | 0.49 | 0.21 |
| Return on average assets | 1.54 | 1.79 | 1.9 | 2.11 | 1.98 | 2.06 | 2.2 | 2.39 | 2.39 | 2.41 |
| Standalone return on equity | 12.3 | 14.1 | 15.4 | 17.1 | 15.9 | 16.6 | 17.6 | 18.9 | 18.9 | 19.1 |
| Weighted average EPS | 26.8 | 31.6 | 35.4 | 41 | 39.8 | 43.1 | 47.3 | 53 | 55.5 | 58.3 |
| Book value | 220 | 226.1 | 234.9 | 245.4 | 255.7 | 261.9 | 274.1 | 287.4 | 301.5 | 308.5 |
Also Read -: How to Read Financial Documents





No comment yet, add your voice below!