In trading, performing the technical analysis is not only important but also becomes the prime tool to know the market conditions and identify the best trading opportunities. Technical indicators play a key role in technical analysis, whether it is done manually by human intelligence or through automated trading software like Algo. Without using the technical indicators analysis would be incomplete.
Though, there are unlimited technical indicators that you can use in technical analysis, but few of them are very popular and can give you better results. In manual trading, analysts choose the indicators as per their trading perspective and interpretational skills. In Algo Trading, the scenario could be different because of algorithms used to train the Algo software to use such tools as per the market conditions.
Use of Technical Indicators in Algo Trading
The technical indicators in Algo Trading play an important role in identifying the best trading opportunity after analyzing the various factors affecting the price movement. Algo use is for identifying the trend, measuring the volatility, checking the level of volume and measuring the momentum.
Also Read: How to Identify Trend in Stock Market: 10 Points to Find Trend
Moreover, in Algo, it helps to identify the support and resistance or overbought and oversold levels to predict the market movement or trend reversal. The main motive for using the technical indicators in Algo Trading is to generate the buy and sell signal with stop loss and target points as per the trading strategy. So, let’s discuss about best technical indicators for algorithm trading.
Top 10 Best Technical Indicators for Algo Trading:
Moving Averages in Algo Trading
Moving averages are one of the most common and widely used technical indicators in Algo Trading. It helps to identify the trend of the market or underlying security. Moreover, it can also help to identify the support and resistance levels in the underlying security or market. There are two types of moving averages Simple Moving Averages (SMA) and Exponential Moving Averages (EMA) used in Algo Trading.
The SMA is calculated by taking the average price of various trading periods, while in EMA the higher weightage is given to the latest prices. When the price of the underlying security or market is trading above the moving average, then its uptrend, while price moving below the moving average is usually considered a downtrend. Algo trading is used in combination with other indicators.
RSI in Algo Trading
This is another very useful and widely used technical indicator also implemented by the Algo trading software while analysing the market. It is a kind of momentum oscillator that helps to measure the speed and change in the market movement or in the price of the underlying security.
It oscillates between the ranges of 0 to 100 and is used to identify if the market is trading in the overbought and oversold zone. When RSI is moving below the 30, it is considered the market is trading in the oversold zone and when it is moving above the 70 levels, it is considered the market is trading in the overbought zone.
Though, in trading the crossover the RSI and moving average can be used for trend reversal. In Algo Trading RSI is used to automate the trading signal when the market is trading in the overbought or oversold zone with the entry and exit points. In AlgoTest or TradeRadar algo trading software, can be also used for trend reversal and taking the right action as per the RSI indications.
Also Read: What are the Best and most Accurate Trend Reversal Indicators
MACD in Algo Trading
This is another useful technical indicator also used by Algo in identifying the correlation or comparison between the two moving averages. There are three lines, MACD line, signal line, and histogram and when the MACD line crosses the signal line it gives the indication of trend and momentum.
In Algo Trading, it is used to identify bullish and bearish trends in the market or in the underlying security while indicating the potential trading opportunities with buy or sell signals. However it can be mainly used to point out the momentum shift with an indication of trend direction.
Bollinger Bands in Algo Trading
This is another useful oscillator that helps to identify the overbought and oversold zone as per the movement or you can say the volatility in the market. There are three bands, the middle one and two outer bands representing the volatility in the market or price of the underlying security. These bands contract and expand as per the level of volatility in the market giving the trade signals accordingly.
Also Read: How to use Bollinger Bands for Day Trading: Intraday Strategy
When the price touches the upper band, it gives the signal the market is trading in the overbought zone, while hitting the lower band indicates the market is moving in the oversold zone. Here Algo Trading system automated such indicators to get the indication of buy or sell signal as per the position of bands. However, these bands can be also used to identify the volatility and potential price breakouts in the market.
Oscillators in Algo Trading
Just like RSI, it is also a momentum oscillator that oscillates between 0 and 100 that compares the closing price of the security’ to its price range over a specific period. When it moves at the level of 20, it indicates the price is trading in the oversold zone, while reading higher than 80 means the market or underlying security is overbought demonstrating the efficiency of security.
In Algo trading the strategies can be activated to respond as per these indications with the entry and exit points automating the trading activities. In Algo trading, a stochastic oscillator plays a greater role in giving the overbought and oversold indication in combination with other indicators.
ATR in Algo Trading
This technical indicator helps to measure the average range between the high and low prices for a specific period, usually 14-day periods. Traders use this indicator to get insight into the market volatility helping them to fix the stop loss and determine position sizes as per the market conditions.
Also Read: How to Use Implied Volatility in Options Trading: Strategies
Unlike other indicators, Average True Range does not provide directional information but is very effective in capturing the market volatility and helps in risk management. Algo Trading is used with other trend-following indicators to confirm signals and optimise their trading strategies.
Fibonacci Retracement Levels
It is one of the best indicators used in technical analysis to find out the potential support and resistance levels based on the various Fibonacci ratios. Based on these ratios values the horizontal lines are drawn showing the multiple supports and resistances at different levels. It helps to know the retracement points when the market moves for a few days in a particular direction.
Also Read: How to Use Fibonacci Retracement for Trading: Setting & Strategy
In Algo Trading, you can use this indicator to automate the trading strategies with the trade conditions based on the price reaching these levels. It helps to identify the trend reversal points after a certain extent of a movement in price can help you to enter into the trade position timely.
ADX in Algo Trading
This indicator is used to identify the strength of a trend that helps traders to avoid trade in the consolidated market helping them to make the right trade decisions. When the ADX line measures the strength of the trend measured through the range of 0 to 100, the higher the value, the stronger the trend.
The positive directional index line is used to measure the measures the strength of the upward trend, while the negative ADX line measures the strength of the downtrend direction. In Algo Trading the ADX can be automated to use in trading strategies but works best when combined with other popular technical indicators like RSI and MACD to get the best results and avoid false signals.
Also Read: What are the Top Best & Most Used Indicators in TradingView
Supertrend in Algo Trading
As the name suggests, really a super trend indicator can truly indicate the trend of the market while acting as support or resistance. As a trend-following indicator, it can be applied for different timeframes like intraday, daily or weekly based on the trading perspectives.
In Algo Trading it can be used to find out whether the trend likely to continue further or not. And if two or more time frames overlap, it indicates that the trend is likely to further continue in future. While the single line in this indicator combines trend detection and volatility.
Parabolic SAR in Algo Trading
Better known as the trend strength indicator in the technical analysis. It is also known as the trend reversal indicator and is used to calculate stop-loss orders and reverse points helping the traders to identify the trends and make the right decision for trading.
In Algo trading, it can be used to set the trailing stop-loss and as per the price movement, it helps in adjusting the stop-loss levels as the trend continues. Parabolic SAR and Acceleration Factor (AF) are directly related to the sensitivity to price changes. A higher AF, means the indicator is more sensitive towards the price change while a lower AF reduces the sensitivity.
Conclusion
Just like manual trading, Algo Trading also uses technical indicators for analysing the market trend and finding the best possible trading opportunities in the market. RSI, Moving Averages, Oscillators, Fib Retracement, Bollinger Bands and supertrend like indicators all used in the Algo Trading or AlgoTest. As per your trading strategy in Algo, these indicators are used in the trading.
Also Read: What are the Hidden Features of AlgoTest in Trade Radar
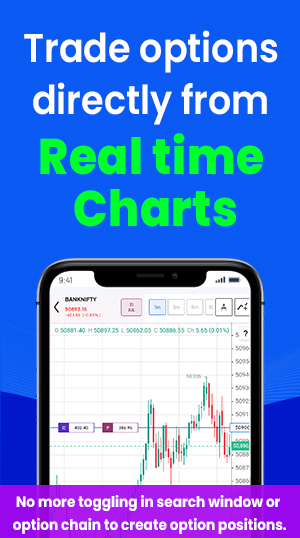
You can enjoy the automated implementation of these indicators in your algorithmic software. If you have a trading and demat account with Moneysukh, you can trade with one of the best Algo trading platformsTradeRadarthrough the Moneysukh Pro mobile trading app. Apart from this, you can also use the Smart Options, to trade in option indices with various features to trade through chart.