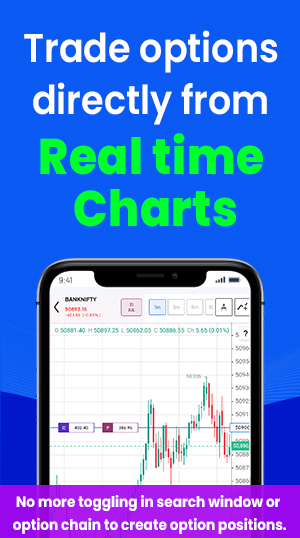
Algo trading has not only become easier but also accessible through portable devices making it informal for traders to trade in options at one click. Smart Options is one of the leading Algo Trading mobile apps offered by Moneysukh to provide the best user interface for manual trading in options.
Though, this Algo Trading app is not fully automated but offers a set of unique features to buy, sell or exit from your trade positions at one click. You can see the chart of the underlying security and directly place the orders from any strike price with facility-applied indicators for analysis. Similarly, there are various interesting features that need to be known to make the best use of this application.
Features of Smart Options for Option Trading
The Smart Options mobile application is developed for traders who prefer to trade through their smartphones. Hence, this application is designed and developed for smartphone users with all the features accessible at one click. Let’s find out its features.
Mobile Based User-Interface
The user interface of Smart Options is completely designed and developed with a wide range of customised options that can be manually managed with one click.
The functions and features in this index options trading app are accessible through the mobile screen with one click with quick action. You can easily navigate or access all the features from your smartphone with live feeds on the chart.
Also Read: Why Choose Algorithmic Software for Options Trading: 10 Reasons
Select the Underlying Indices
Though this application is available only for the index options, you can find all the leading indices like Nifty Banknifty etc. traded in the options with their respective details.
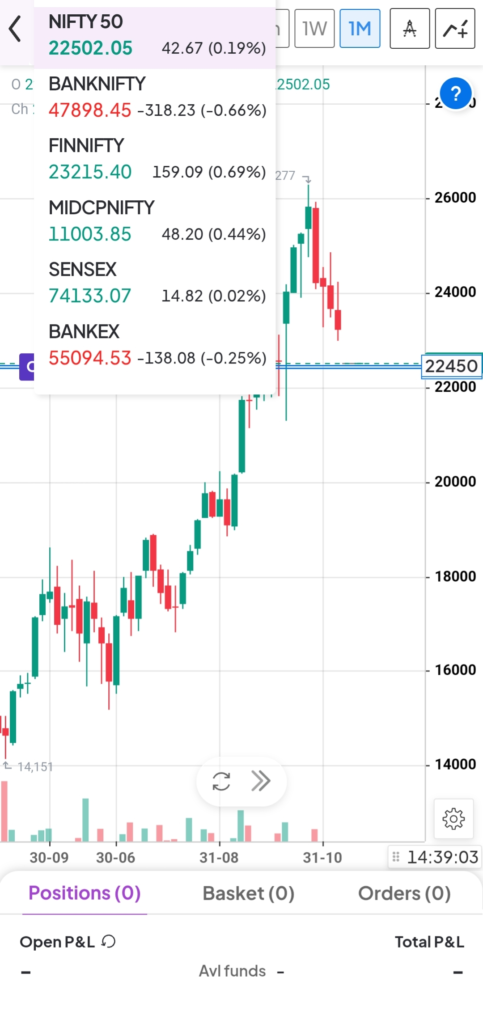
On the top left corner, you can select to see and choose all the index options traded in the market. You can simply select the underlying index you want to see the chart and other details on your mobile screen.
Select Expiry at One Click
As you know in the option market, at the same time multiple contracts of different expiry dates are available for the users. You can select the expiry date from the menu given the upper bar with all the current month and upcoming month contracts traded on the exchange.

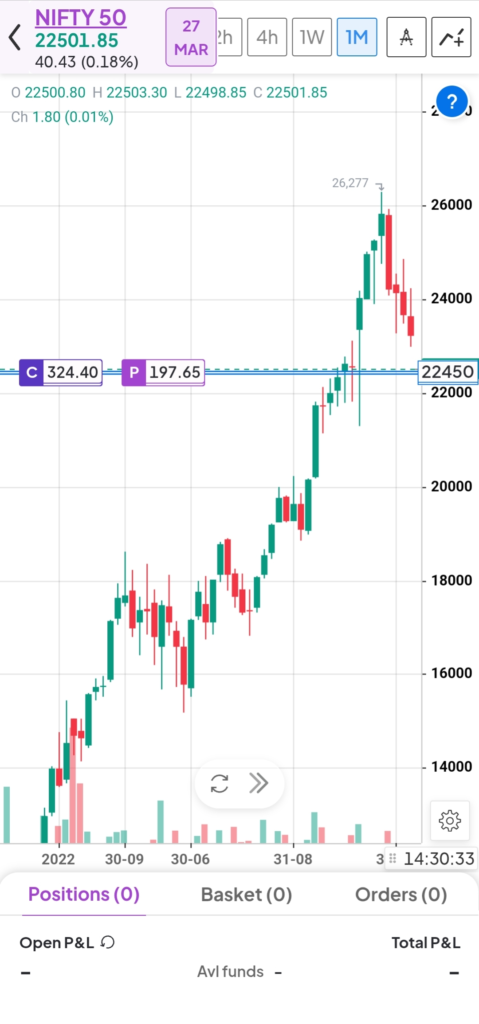
When you select a particular expiry date, a price chart of the selected underlying security becomes visible on the graph.
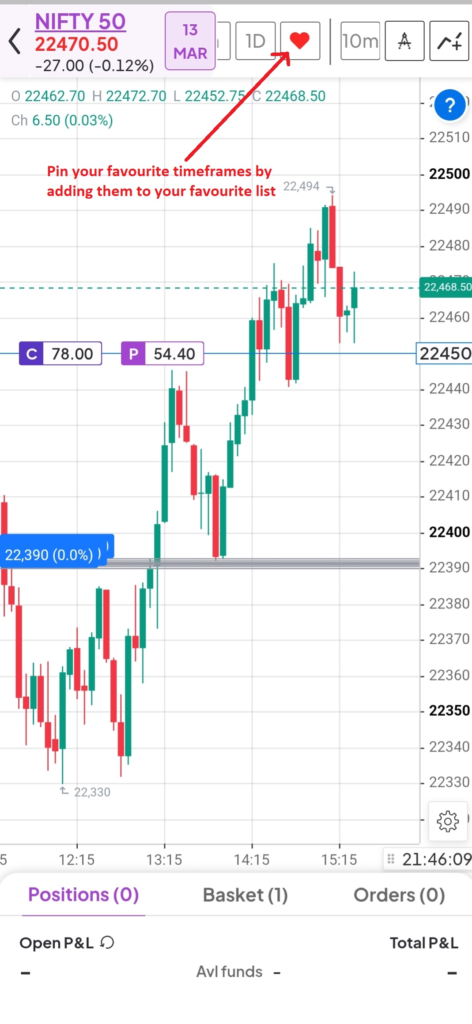
Chose from the Timeframes
In Smart Options you can choose the different time frames to see the chart with tick-by-tick updates of the price of the graph. You can choose from 1 minute to 5, 10, 15 or 30-minute chart or can select the daily, weekly or monthly timeframe to see the price movement as per your trading strategy.
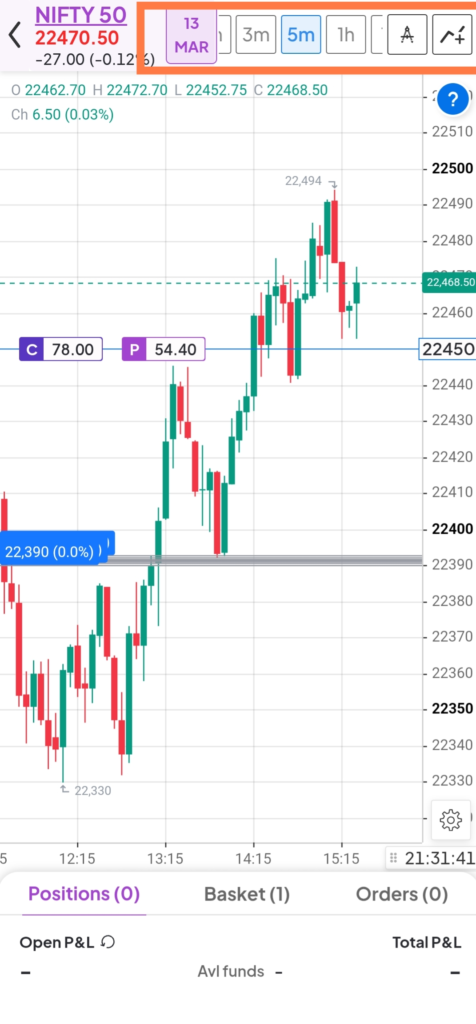
You can also pin your favourite timeframes by adding them to your favourite list, and once you added it will be visible at the top menu with navigation to quickly select from the list of your favourite timeframe.
Also Read: What Time Frame is Best for Intraday, Option & Swing Trading
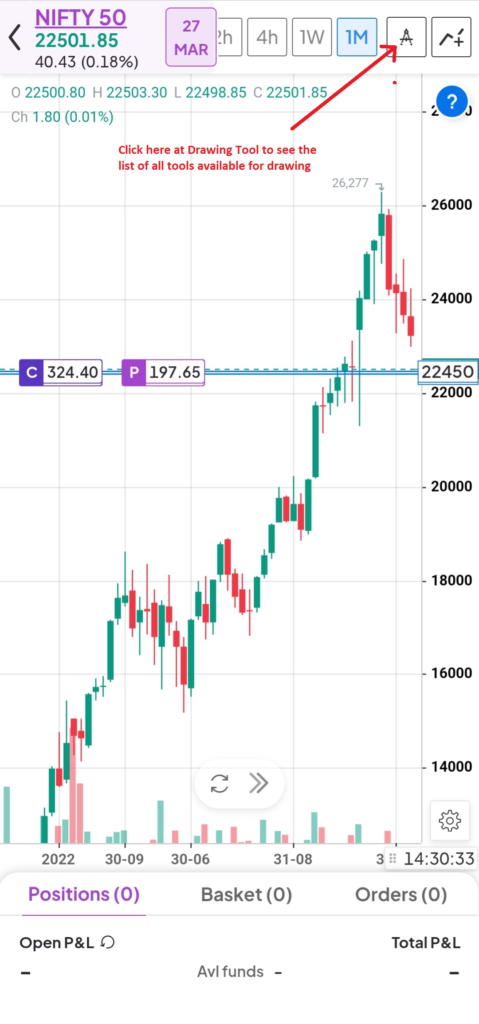
Drawing Tools for Graph
This is another useful feature available here allowing the traders to draw lines or another type of diagram directly on the chart. To see the list of lines and diagrams you can click on the drawing toolbar located at the second position at the top right corner.
Once you click this drawing toolbar you can see the list of all the lines and tools available for drawing and it will be visible on the left-hand side.
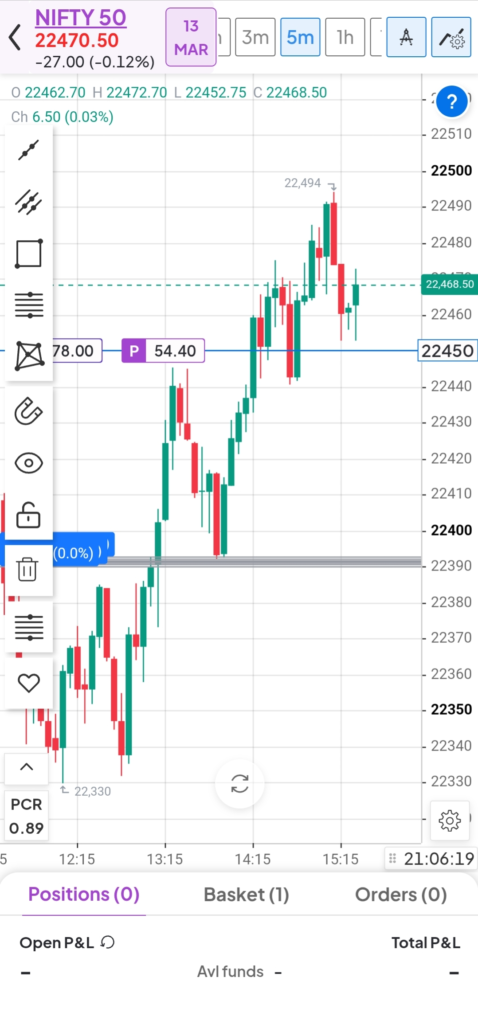
You can also add any of the drawing toolsto your favourite list so that you can apply them directly on the chart with one click. You can lock or delete any of the drawing tools from the list in this menu to highlight or illustrate your option strategy on the chart.
Also Read: What are the 4 Levels of Advanced Options Strategies to Trade
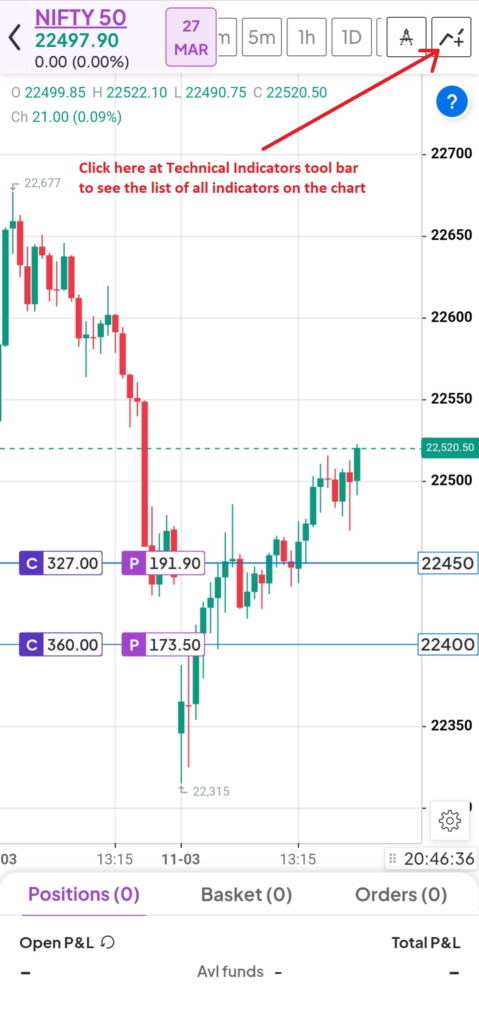
Apply Technical Indicators
This is one of the most important features that should be available on every trading platform. The technical indicators, without that you would be not able to perform the technical analysis. Here you can click on the indicator menu at the top right corner to see the list of all the technical indicators.
To add any particular indicator you can type the name in the search bar and click on the plus icon on the right side to select the indicator and change its parameters and style like colours and pixel density of lines.
![]()
After selecting your favorite indicator just click on save to apply this indicator on the chart. You can delete, hide or edit your existing applied indicator with the option to add more indicators.
Apart from all the common and most popular technical indicators, there two more special indicators are also available here. You can also apply the open interest and futures indicators on the chart to better analyse your option strategy with changes in OI.

Also Read: How to Use Open Interest for Intraday Trading or Trading
Quick Chart with Live Feed
Option trading Smart Options becomes more interactive with the live feeds of all the data like the price of calls and puts of the underlying security for different strike prices with trading volume and other details all are visible on the chart. By default, you can see the candlestick charts and when you select any particular underlying index of a particular expiry it will be visible on the quick chart.
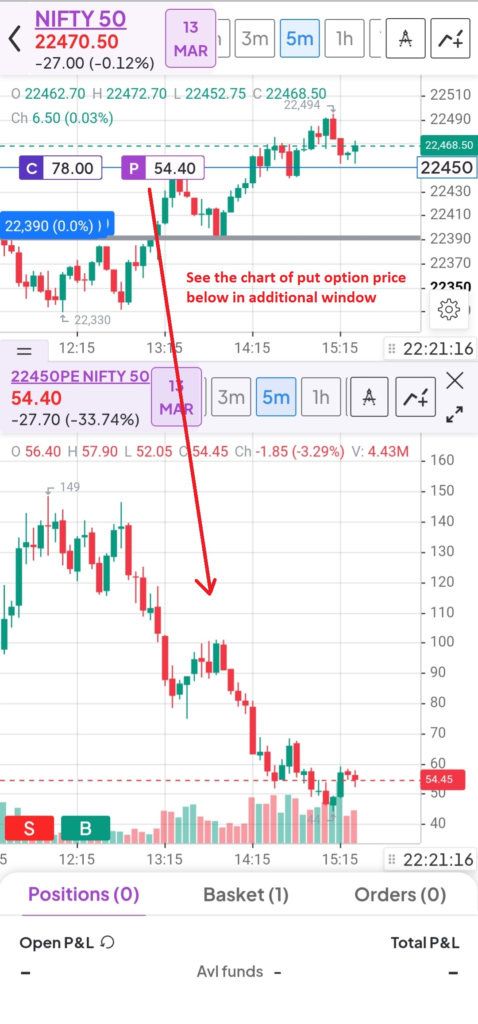
Call and Put Prices on Chart
In option trading, you have two options to enter into a trade position call or put. You can choose the combination of calls and puts to enter into a particular trade position.
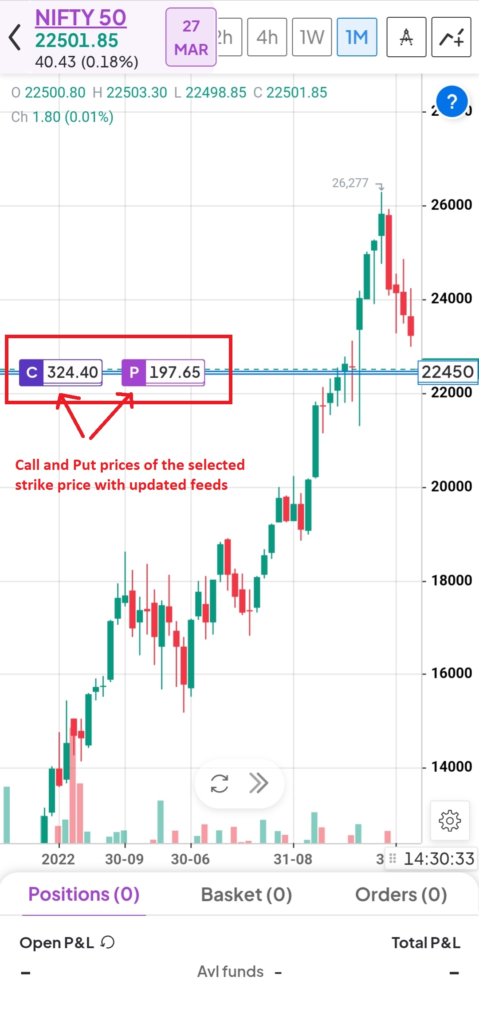
To find the updated prices of premium of each call and put for various strike prices is visible along with the line of the strike price you select on the chart to add all the details before placing the orders.
Place the Orders on the Chart
For option traders, this is one the best features integrated on the live chart to place the orders just select the right option of a particular strike price and swipe the same to execute your orders.
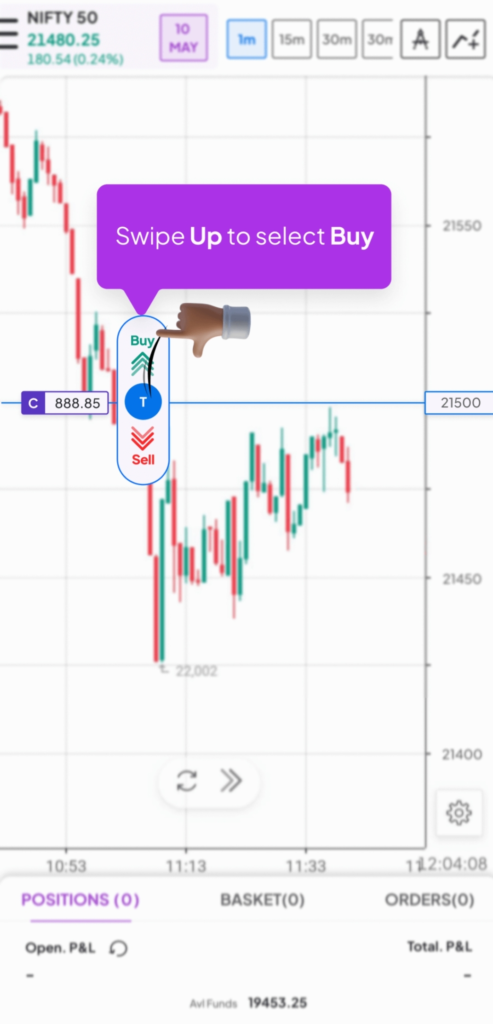
You can also choose the order quantity and order type like market price or limit order while placing your order.
Also Read: Types of Orders in Option Trading in Algo with Order Placement Tips
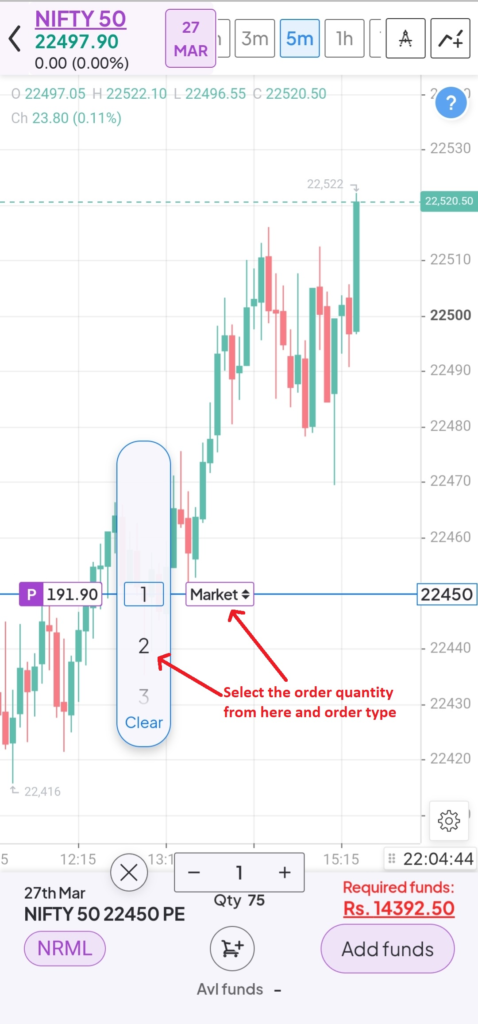
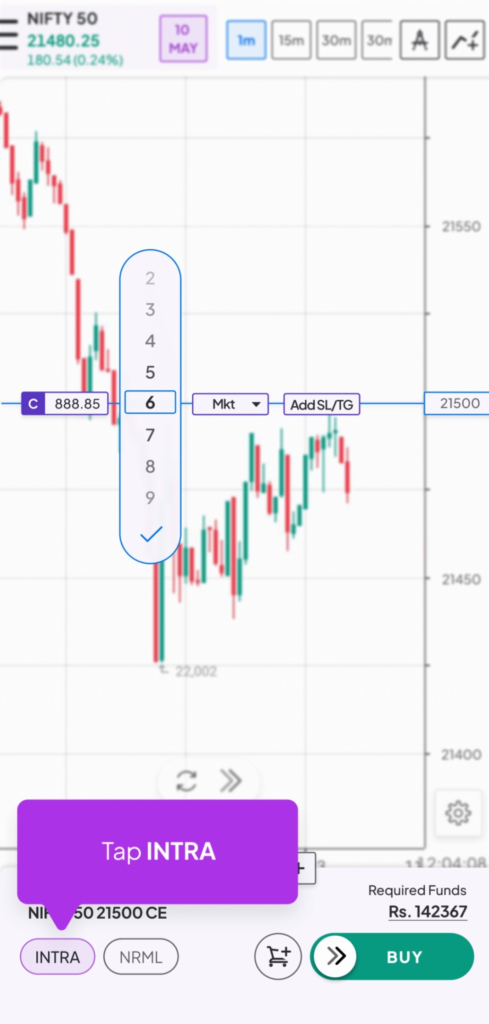
And when you select a call or put option of a strike price you can also see the chart of that particular strike price with the option to place or modify your orders directly from that chart area. And while placing the orders you can choose from intraday or normal orders from the bottom left corner. From the bottom menu, you can click the option to exit from all your trade positions anytime.
Trade Directly from Strike Price
Using the Smart Options on the Moneysukh trading app, you can place orders by choosing the strike price directly on the chart. To use this feature you just need to simply click any in-the-money or out-of-the-money strike price visible on the Y-axis of the chart.

When you select the strike price you can see the call put options with the updated price of the premium with the swiping facility to buy or sell the option.

Also Read: How to Choose or Pick the Right Strike Price in Option Trading
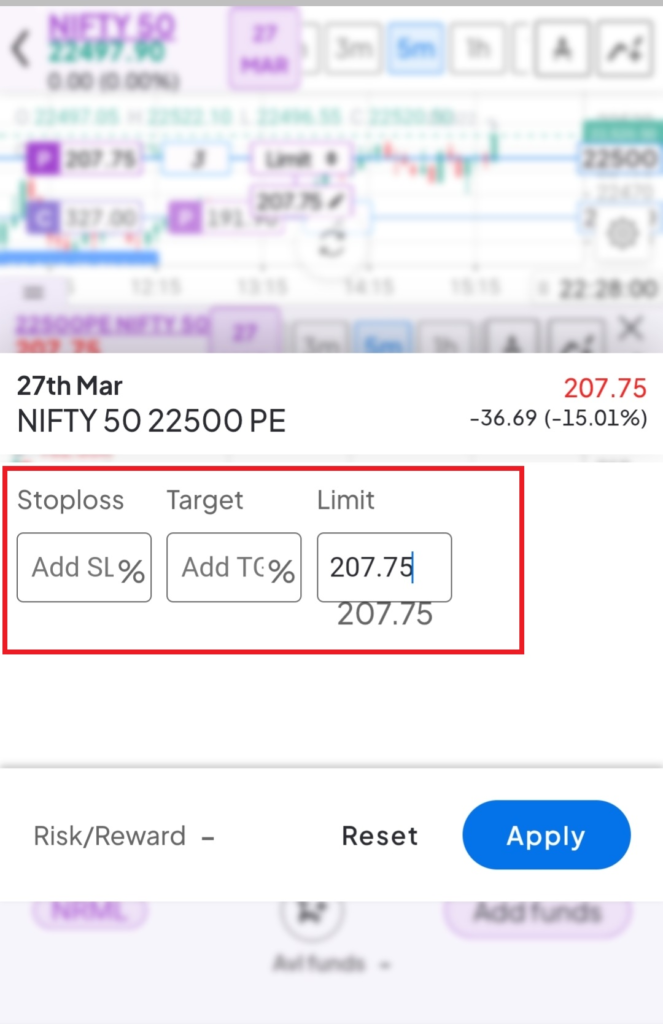
When you swipe for buy or sell you can set the quantity (in lot size) and also choose from market price or set the limit price with the facility to also add the stop loss (SL) and target (TGT) for this particular trader position.
You can manually change the SL and TGT price or can choose in percentage from the predefined values given an additional function for each trade position.
Set Stop Loss and Targets
Merely placing your orders from call or put options is not enough with Smart Options, instead, you can also ensure your profitability with the right risk management strategy in the option trading. Yes, you can set the targets and stop loss on the charts while placing your orders.
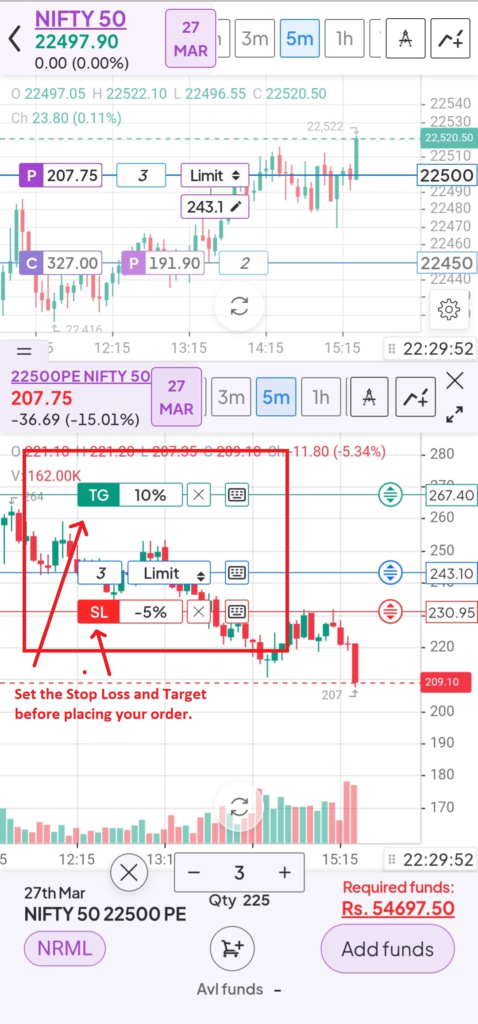
Here you can choose the right stop loss and target points with options to choose the SL and TGT as per your calculated value or you can set the percentage of the execution price to automatically book profits or exit on these levels.
Select the Strike Price from the Chart
While trading in options you have to choose the right strike price from the option chain and that is a cumbersome process for the traders. But trading with Smart Options you can choose from the various strike prices directly through the chart and enter into trade position for that particular strike price.

And you can choose from At-the-money strike prices to in-the-money or out-of-the-money strike prices as per your view towards the underlying index and your trading strategy.
You can also choose multiple strike prices and place different orders (call or put) for the same underlying index. At the time of placing the buy or sell orders, you can also see the price chart of a particular strike price.

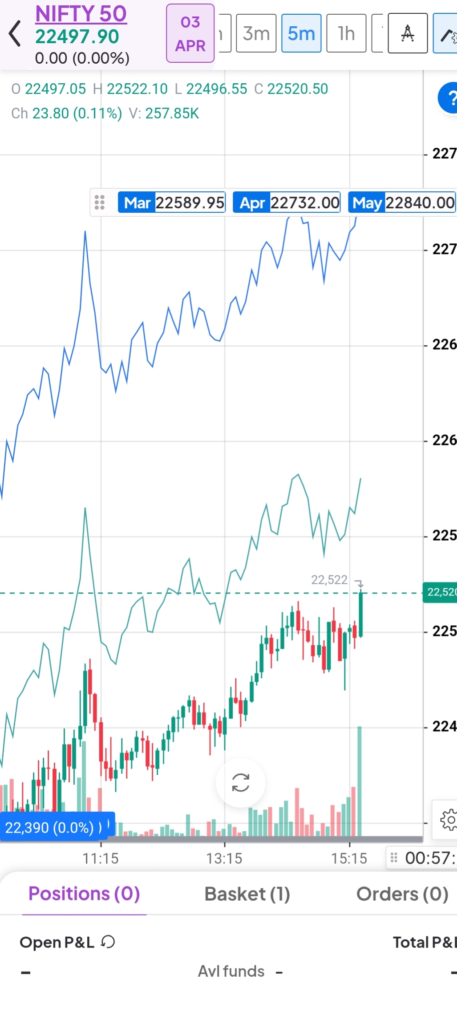
Add Underlying Futures on the Chart
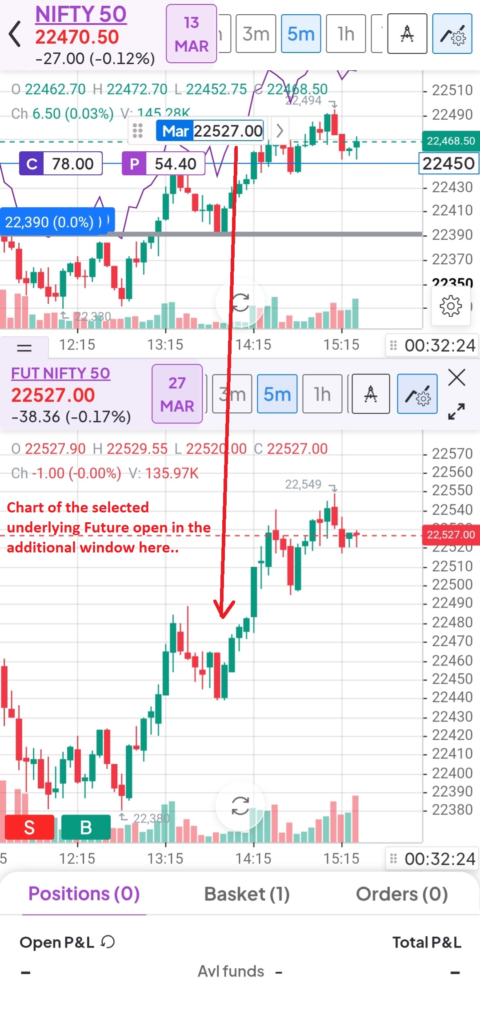
This is another unique or you can say a special feature that you can use in the smart options to make your trade positions more diversified. Yes, apart from selecting the underlying index from the option chain, you can also add futures of the underlying indices in your trading strategy. You can not only add the futures on the existing chart but can also buy or sell directly from the chart area.
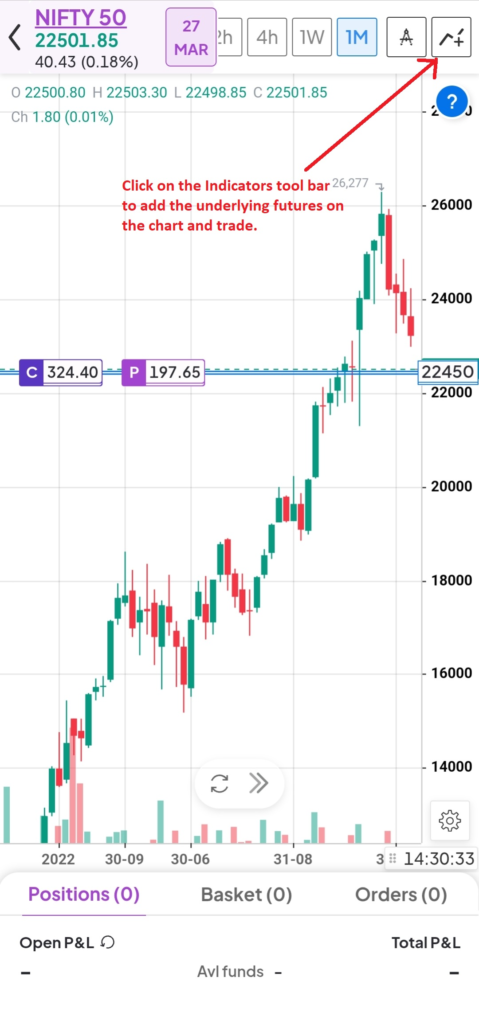
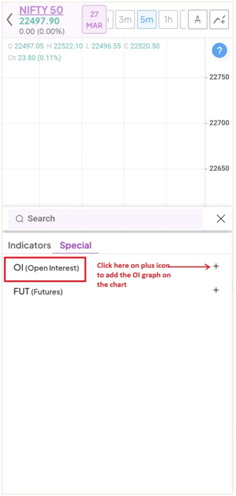
To add the futures of the selected underlying index you have to go to the indicator toolbar and select the same to see the list of all indicators. And when you click on the indicator toolbar you can see the list of all indicators along with a sub-menu in the name of “special”.

When you click on this you can see here the open interest and futures that you can click to add on the chart. You can select here the existing month or next two months or all three months’ futures on the same chart area.
Also Read: What is Futures Trading in F&O: How it Works and Pros & Cons
Add OI Graph on the Chart
Finally, this is another very important feature for options trading that you can use in the Smart Options Algo trading software.

You can also add the Open Interest (OI) data in the form of bars on the chart area to see the changes in the OI for particular strike prices or different strike prices at the same time.
Also Read: Nifty Open Interest: How Traders Use Change in Nifty OI for Data Analysis
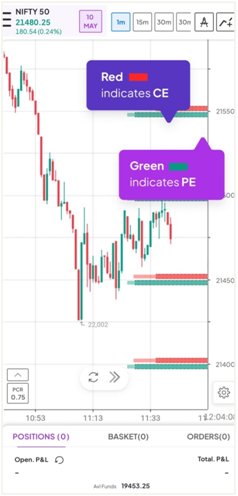
To add this function you have to again open the indicator toolbar and go to the “special” section select the OI and then set the other parameters like the number of strike prices, the location of OI data on the graph and the OI view in the actual format or in the delta format.]
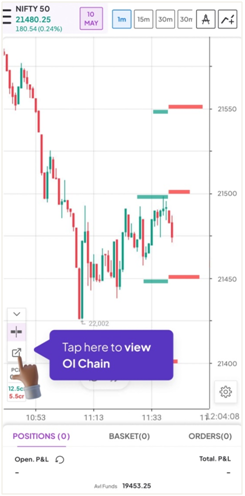
After applying this function at the left side bottom you can also see the put call ratio (PCR) of that particular strike price with the option to expand the PCR function and see the list of all PCR for the different strike prices with the latest OI data through option chain.

Summing-up
Smart Options is a mobile-based best Algo trading platform in which can select your option index and place the orders directly choosing the strike price of the graph. You can select any strike price with the buy and sell feature on call and put the option of selected strike price. You can choose expiry and multiple timeframes with a click facility to apply indicators or draw lines on the chart.
You can set stop loss and target for each trade position or can also analyse the chart of each strike price with other key data like PCR and margin required or fund availability in your account. Through the charts, you can book profits fully and partiallyor completely exit from your trade position at one click.
Also Read: How to Recover Loss in Option Trading: Tips to Avoid Losses
Moreover, you can also add futures of the index in your trade position or draw the OI chart on the graph to get more insight into the trading activities in the underlying instrument. You can enjoy the power of Algo Trading with manual controlling through Smart Options offered by Moneysukh. So, open your trading and demat account with Moneysukh and enjoy the seamless option trading on your mobile.