


Introduction
Intraday breakout stocks refer to those stocks that experience a significant price movement during a single trading day, breaking out of their previous trading range. These stocks often exhibit strong momentum and attract the attention of traders and investors looking to capitalize on short-term price fluctuations.

Identifying intraday breakout stocks is important because it allows traders and investors to potentially profit from short-term price movements. By identifying stocks that are breaking out of their previous trading range, traders can take advantage of the momentum and volatility to enter or exit positions at favorable prices. This strategy can be particularly beneficial for day traders who aim to capitalize on intraday price fluctuations.
Strategies for Identifying Intraday Breakout Stocks
1. Technical analysis Techniques to identify potential breakout stocks include trendline analysis, moving averages, and volume analysis. These techniques can help traders identify stocks that are showing signs of a potential breakout, such as a strong uptrend, increasing volume, and price breaking through key resistance levels. Additionally, traders can also use momentum indicators like the Relative Strength Index (RSI) or the Moving Average Convergence Divergence (MACD) to confirm the strength of the breakout and make more informed trading decisions.
Also read: How to Use Moving Averages in Trading & Convergence Divergence?

2. Trendlines and channels are also useful tools for identifying potential breakouts. By drawing trendlines and channels on a stock’s price chart, traders can visually see the direction and strength of the trend. Breakouts occur when the price breaks above or below these trendlines or channels, indicating a potential change in the stock’s direction. This can provide traders with additional confirmation and increase their confidence in taking a position during a breakout.
3. Moving averages are another popular tool used by traders to identify potential breakouts. By calculating the average price of a stock over a specific time period, moving averages help smooth out short-term fluctuations and highlight the overall trend. Traders often look for breakouts when the stock’s price crosses above or below its moving average, as this can signal a shift in momentum and potential opportunities for profit. Additionally, combining moving averages with other technical indicators can further enhance the accuracy of breakout predictions.
4. Relative strength index (RSI) is a commonly used technical indicator that measures the speed and change of price movements. It can help traders identify overbought or oversold conditions in a stock, which can be useful in confirming potential breakouts indicated by moving averages. By using both moving averages and RSI together, traders can gain a more comprehensive understanding of the stock’s momentum and make more informed trading decisions.
Also read: What is RSI in Trading & How RSI Works? Formula and Strategy
How to start intraday trading with Trade Radar
Trading, investing, speculating, and hedging are all made much easier using Trade Radar, India’s top Financial Markets Data Analytics platform, which is owned by Mansukh Securities & Finance Ltd. These cutting-edge, cloud-based algorithmic tools give users a leg up in the market when it comes to making decisions. They’re accessible from anywhere and have an intuitive user interface that lets anyone execute complicated analytics on their own without having to learn programming or pay for assistance.
What do we offer?
Market Heat Map: Get the inside picture of the market quickly. Just spend a couple of minutes on our Heatmap page and get a top-down view of the market daily.

Also read: What is Heat Map in Stock Market: How Heatmap Works & Used?
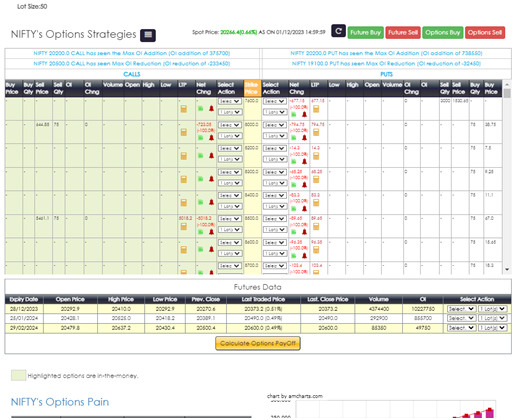
Option Strategies Builder: Develop and evaluate your personal trading strategies in Options. Receive strategy-based alerts every day. Get access to inbuilt option strategies absolutely free.
Powerful stock screeners to identify trade opportunities: Use our powerful technical screener based on candlesticks and other indicators to identify winning stocks on the basis of solid data analysis and pattern matching. (Intraday and EOD)
How to trade on intraday screeners
- Intraday Trading System: For our clients, it’s a straightforward dashboard that packs a significant punch. Based on specific factors, such as swing buy/sell and bullish/bearish candle formations, we have indulged in a powerful set of screeners. In addition, our robust code ensures that users have an ideal intraday call experience with accurate target and stop loss levels.
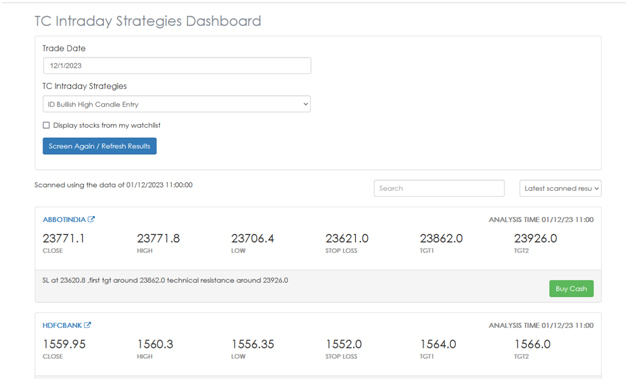
- Custom screeners- We have an inbuilt set of screeners, as seen in the picture below.

There are both intraday and end-of-day (EOD) screeners available, and they use a variety of technical factors, such as possible breakouts, swing buy-sell patterns, and bullish and bearish patterns based on candlesticks. Depending on his preferences, any Moneysukh client can pick and trade at the same time.
- Realtime candlestick patterns: Pro traders with extensive knowledge of candlestick patterns are the target audience for these screeners. Users have the ability to trade in real-time using a variety of candlestick patterns.

- Ready-to-use screeners: Our users and newcomers alike will find these screeners to be an excellent resource. Indicators based on technical analysis combine to form these stock patterns. Any user of Moneysukh can access the results by clicking the execute button on the screener they have chosen.

- Divergence screener: Divergence refers to a situation where the performance of different indices or individual stocks deviates from each other. It occurs when there is a disparity in the direction or magnitude of price movements between various segments of the market. This phenomenon can be observed in both short-term and long-term timeframes. In order to cater to professional traders, we have developed these screeners and divided them into several combinations of technical indicators, such as William R, MACD, and stochastic. If the user wants to find stocks, they can use any divergence screener.

- Intraday Pattern: To help traders find stocks, we have synced several prominent chart pattern screeners in this area, including Bollinger Band, Double Bottom, and Double Top. To get fast results and trade at the same time, Moneysukh users can choose any screener. Just a heads up: these screeners are limited to F&O stocks only.

Also read: How to Find Trending Stocks for Intraday Trading: Ten Rules
- Pattern and trendline screeners: These screeners are more compatible with pro traders. These screeners are the perfect blend of Technical Indicators and Trendline breakouts—breakdowns. Traders can quickly and easily screen for classic technical reversal patterns like the Head & Shoulders, Inverted Head & Shoulders, Double Top, Double Bottom, Triple Top, and Triple Bottom patterns, as well as bullish and bearish trendlines, triangle chart patterns, and more with the help of our powerful EOD Pattern and Trend Line Screener. Incorporating these patterns into technical analysis studies is a certain way to boost their chances of success in the stock market. From the pattern screener’s results, you can easily observe the H, L, R-marked Head & Shoulders, D,D marked Double Top, and T,T marked Double Top on stock charts by clicking on the chart button.

On top of that, we have pre-made screeners like Swing Buy/Sell and Stock Bottoming Out/Topping Out so that any client, pro or simple, may use them to quickly achieve the results they want. The fact that these screeners are free to our clients is the most crucial thing.


No comment yet, add your voice below!